
Figure 3.
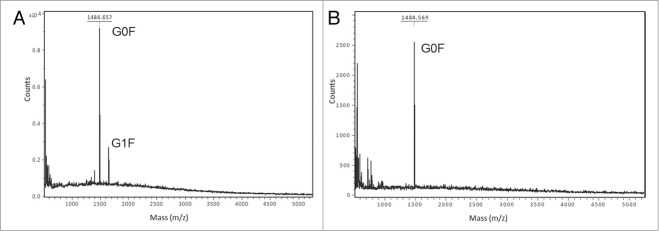
Glycoforms of IgG1 m860 produced from CHO cells. MS analysis of N-glycans after β-galactosidase and sialydase treatment of IgG1 m860. (A) MALDI-TOF MS analysis of N-glycans released by PNGase F treatment of native IgG1 m860. G0F glycoform with a peak at 1485.6 m/z, the G1F glycoform with a peak at 1647.6 m/z, and G2F glycoform was not detected in this preparation. IgG1 m860 was treated with β-galactosidase to obtain a homogeneous G0F glycoform population (B) MALDI-TOF analysis of N-glycans released by PNGase F treatment of β-galactosidase treated IgG1 m860. Only the G0F glycoform with a peak at 1485.6 m/z is seen after treatment.