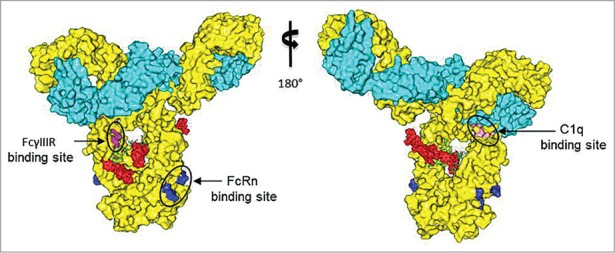
Figure 8.

A three-dimensional molecular model of the IgG1 m860-nAF ADC. Heavy and light chains of IgG1 m860 are shown in yellow and cyan, respectively, and four nAF molecules are shown as red spheres. Mutational data along with the structural analyses from previous studies revealed amino acids critical for binding to FcRn (blue), C1q (pink) and FcγRIII (magenta) which are mapped in the m860ADC model.
