Abstract
Objective
Despite advances in the early diagnosis of gastrointestinal (GI) cancers, these cancers are often being detected rather late in their course. Emerging published data on the accuracy of dickkopf-1 (DKK1) for diagnosing GI cancers are inconsistent. The purpose of this systematic review and meta-analysis was to evaluate the diagnostic value of DKK1 in the diagnosis of GI cancers.
Methods
A systematic literature search of PubMed, Web of Science, Embase, Chinese National Knowledge Infrastructure, and WANFANG databases was conducted to identify the related studies published before May 1, 2015, which investigated the diagnostic value of serum DKK1 for GI cancers. The methodological quality of each study was assessed according to the Quality Assessment of Diagnostic Accuracy Studies 2 checklist. The diagnostic performance was pooled and analyzed using a bivariate model. Publication bias was evaluated with the Deeks’ funnel test.
Results
A total of 15 studies with 5,076 participants were finally identified for the meta-analysis. The pooled results of sensitivity (SEN), specificity (SPE), positive likelihood ratio, negative likelihood ratio, and diagnostic odds ratio for DKK1 test were 0.72 (95% confidence interval [CI]: 0.70–0.74), 0.90 (95% CI: 0.89–0.91), 7.72 (95% CI: 4.90–12.14), 0.29 (95% CI: 0.22–0.39), and 28.95 (95% CI: 16.25–51.65) for diagnosis of GI cancers, respectively. The area under the summary receiver–operating characteristic curve was 0.8901. The SEN of DKK1 in diagnosis of gastric cancer and pancreatic cancer may be higher than hepatocellular carcinoma, and the SPE in pancreatic cancer subgroup was lower than hepatocellular carcinoma and gastric cancer subgroups.
Conclusion
The currently available evidence suggests that serum DKK1 is a potential biomarker with high SEN and SPE for screening GI cancers. To better elucidate the usefulness of serum DKK1, further studies are needed.
Keywords: gastrointestinal cancer, dickkopf-1, cancer screening, accuracy
Introduction
Gastrointestinal (GI) cancers, which refer to the cancers generated from esophagus, stomach, intestine, gallbladder, liver, and pancreas, collectively rank as the most lethal cancers worldwide.1 In 2012, the high incidence of GI cancers involves an estimated 284,680 new cases and 142,510 deaths in United States.2 Despite advances in the diagnosis of GI cancers, these cancers are often being detected rather late in their course, as the detection relies heavily on symptomatic reporting and on nonspecific screening methods.3 Most of the patients are diagnosed at the late stage and lose the opportunities of effective medical interventions, and ~20%–45% of those who undergo curative resection subsequently develop tumor recurrence or distant metastasis due to highly aggressive nature of GI cancers.4 Thus, diagnosis of GI cancers at an early stage is of utmost importance for reducing GI cancer-associated mortality.
Dickkopf-1 (DKK1) is a known inhibitor of the Wnt signaling pathway, which plays an important role in a variety of cellular processes, including proliferation, differentiation, survival, apoptosis, and cell motility.5–7 Since its discovery, abnormal DKK1 expression has been reported to be associated with diagnosis, prognosis, metastasis, and even survival in a variety of neoplasms.8–12 As a small secretary protein with 266 amino acid (35 kDa), serum DKK1 level has been found to be increased in patients with different cancers.8,13–16 However, the diagnostic accuracy of DKK1 for different GI cancers was inconsistent or even contradictory in literature, which may be explained in part by different cancer types, study design, sample size, and ethnicity. In the present study, we performed a meta-analysis and estimated the pooled accuracy of DKK1 detection in diagnosing GI cancers.
Materials and methods
Literature search
A systematic literature search of PubMed, Web of Science, Embase, Chinese National Knowledge Infrastructure, and WANFANG databases was conducted to identify the related studies published before May 1, 2015, which investigated the diagnostic value of serum DKK1 for GI cancers. The following search terms were used: “gastrointestinal cancer”, “gastrointestinal carcinoma”; “Dickkopf-1”, “DKK1”; “blood”, “serum”, “circulating”; “diagnosis”; and “sensitivity and specificity” were used individually and in various pairwise combinations. All eligible studies were retrieved, and their bibliographies were checked for other relevant publications. No limitation was set on the language of the article.
Inclusion and exclusion criteria
All eligible studies satisfying the following criteria were included in the meta-analysis: 1) DKK1 level was determined; 2) all patients diagnosed with GI cancer, irrespective of their age and cancer stage; 3) sensitivity (SEN) and specificity (SPE) of DKK1 were reported to provide sufficient information to construct 2×2 contingency tables, or sufficiently detailed data were presented to derive these numbers. Exclusion criteria were as follows: 1) incomplete data to construct 2×2 contingency tables, 2) duplicate studies, and 3) reviews, letters, and comments.
Data extraction and quality assessment
Data extraction was performed independently by two authors using a standardized data extraction form including the following elements: author’s name, publication year, country, number of cases and controls, control source, test method, SEN and SPE data, and cutoff value. Two investigators assessed the risk of bias in each study by using the Quality Assessment of Diagnostic Accuracy Studies 2 tool. Any disagreement was resolved by consensus.
Statistical analysis
The data were analyzed using Stata 12.0 (StataCor LP, College Station, TX, USA) and Meta-disc 1.4 (XI Cochrane Colloquium, Barcelona, Spain) softwares. In this meta-analysis, the pooled SEN, pooled SPE, positive likelihood ratio (PLR), negative likelihood ratio (NLR), diagnostic odds ratio (DOR), and 95% confidence interval (CI) were calculated using the DerSimonian–Laird method. The present study used Moses linear model to draw a summary receiver–operating characteristic (SROC) curve, which summarized the joint distribution of SEN and SPE. An examination of the potential sources of heterogeneity is indispensable for any meta-analysis before pooling the data from the included studies into summary assessments. We used a Spearman correlation analysis to quantify the heterogeneity due to the threshold effect among the included studies. Moreover, the Cochran Q-test and the inconsistency index (I2) test were used to assess the nonthreshold effect. When the result of the Q-test and I2 statistics suggested heterogeneity (P≤0.05 and I2>50%), a random-effects model (DerSimonian–Laird method) was used; otherwise, fixed-effects model (Mantel–Haenszel method) was adopted. The Deeks’ funnel plot was used to estimate the potential publication bias among studies, and P<0.05 was considered to be representative of a significant statistical publication bias.
Results
Characteristics of the included studies
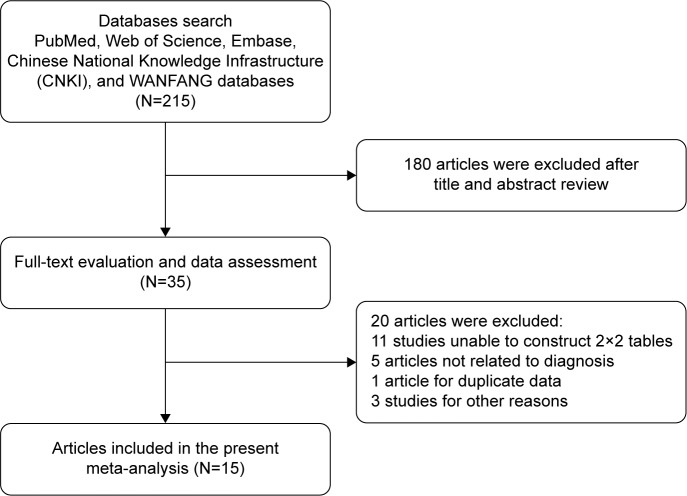
Flow chart for study selection is shown in Figure 1. We identified 215 references from electronic databases using the previously described strategy. According to the inclusion criteria, 35 studies were retrieved and required further evaluation after screening the title, abstract, or both. With further screening of full texts, 20 studies were excluded for various reasons. Finally, a total of 15 studies with 5,076 participants were identified for the meta-analysis.17–31 Of the 15 studies, three of the studies involved patients with gastric cancer (GC),17,25,27 eight involved patients with hepatocellular carcinoma (HCC),18,20,21,23,26,30–32 two involved patients with pancreatic cancer (PC),19,24 one involved patients with esophageal cancer,22 and one involved patients with colorectal cancer.28 Sample size of the included studies ranged from 63 to 831. The characteristics of the 15 included studies are listed in Table 1.
Figure 1.
Flow chart of selection process.
Table 1.
The characteristics of 15 eligible studies
| Author | Year | Country | Cancer type | Case/controls | Control type | Test method | Cutoff values | SEN/SPE |
|---|---|---|---|---|---|---|---|---|
| Lee et al17 | 2012 | Korea | GC | 153/173 | HC | ELISA | 31.9150 pg/mL | 87.6%/87.9% |
| Shen et al18 | 2012 | People’s Republic of China | HCC | 424/407 | HBV, LC, and HC | ELISA | 2.153 ng/mL | 69.1%/90.6% |
| Shen et al18 | 2012 | People’s Republic of China | HCC | 209/244 | HBV, LC, and HC | ELISA | 2.153 ng/mL | 70.9%/90.5% |
| Han et al19 | 2015 | People’s Republic of China | PC | 140/92 | Benign, HC | ELISA | 1,560.02 pg/mL | 89.3%/79.3% |
| Bo and Qin20 | 2014 | People’s Republic of China | HCC | 69/71 | Benign, HC | ELISA | NA | 69.6%/95.8% |
| Tong et al21 | 2014 | People’s Republic of China | HCC | 103/423 | HBV, LC, and HC | ELISA | NA | 71.8%/93.6% |
| Li et al22 | 2009 | People’s Republic of China | EC | 80/35 | HC | ELISA | 14.54 ng/mL | 66.25%/82.86% |
| Qin and Bo23 | 2014 | People’s Republic of China | HCC | 112/148 | Benign, HC | ELISA | 2.16 ng/mL | 74.1%/94.6% |
| Wang et al24 | 2014 | People’s Republic of China | PC | 44/19 | Benign | ELISA | NA | 76.9%/100.0% |
| Zhang et al25 | 2010 | People’s Republic of China | GC | 34/38 | HC | ELISA | 3.539 μg/mL | 61.8%/84.2% |
| Zhong et al26 | 2015 | People’s Republic of China | HCC | 81/150 | HBV, LC, and HC | ELISA | 4.48 ng/mL | 71.6%/90.0% |
| Gomceli et al27 | 2012 | Turkey | GC | 60/60 | HC | ELISA | 25 U/mL | 100%/100% |
| Soydinc et al28 | 2011 | Turkey | CRC | 295/90 | HC | ELISA | 29.36 ng/mL | 59.3%/50.0% |
| Yang et al31 | 2013 | People’s Republic of China | HCC | 104/342 | HBV, LC, benign, and HC | ELISA | 4.14 ng/mL | 76.0%/93.8% |
| Yang et al31 | 2013 | People’s Republic of China | HCC | 80/256 | HBV, LC, benign, and HC | ELISA | 4.14 ng/mL | 73.8%/95.6% |
| Tung and Ng29 | 2012 | Hong Kong | HCC | 100/50 | HBV | ELISA | 1,209 pg/mL | 30.43%/100% |
| Ge et al30 | 2015 | People’s Republic of China | HCC | 89/301 | HBV, LC, and HC | ELISA | 79.78%/89.37% |
Abbreviations: SEN, sensitivity; SPE, specificity; GC, gastric cancer; HC, healthy control; ELISA, enzyme-linked immunosorbent assay; HCC, hepatocellular carcinoma; LC, liver cirrhosis; PC, pancreatic cancer; NA, nonavailable; EC, esophageal cancer; CRC, colorectal cancer; HBV, hepatitis B virus.
Quality assessment of the included studies
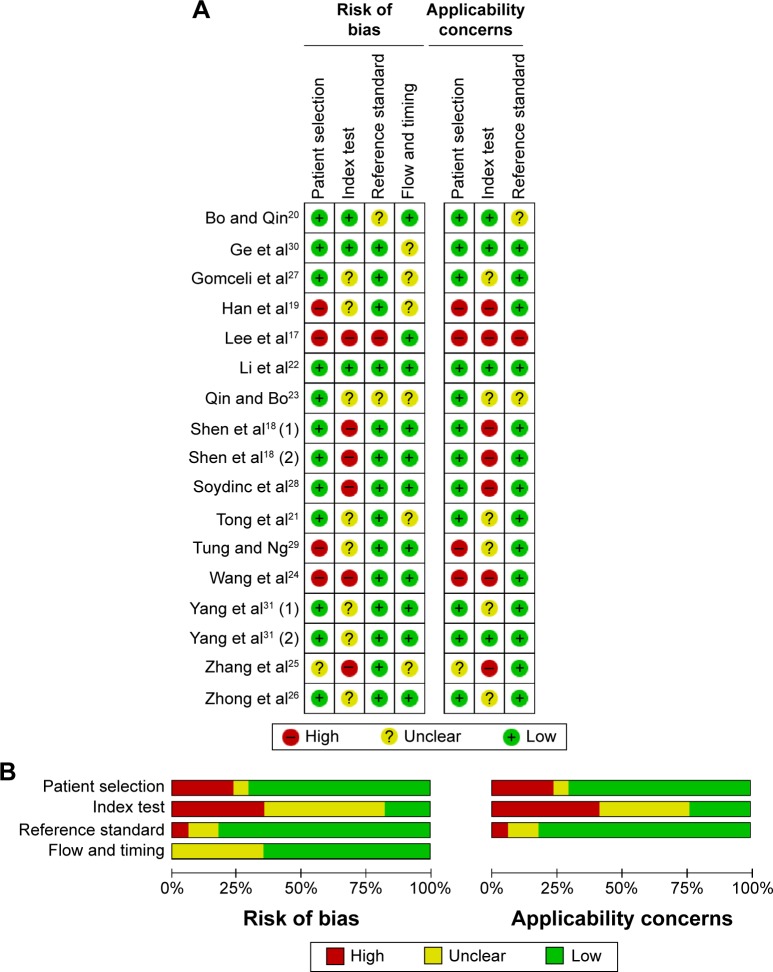
The methodological quality of the included studies is summarized in Figure 2. The results of Quality Assessment of Diagnostic Accuracy Studies (QUADAS-2) indicated that the four studies showed high risk of bias and one study showed uncertain bias due to the case–control study design or inexplicit report. As for index test, the overwhelming majority (82.4%) studies were at high or uncertain risk due to insufficient information to judge whether the diagnostic threshold was not prespecified. Although we could not judge whether these studies were interpreted blind, three studies were at high risk or uncertain risk for reference standard. Concerning the flow and timing domain, six studies were considered at uncertain bias because the authors did not disclose whether all of the participants received the same reference standard.
Figure 2.
Summary of the quality of the included studies according to QUADAS-2 tool.
Notes: Risk of bias and applicability concerns summary (A); risk of bias and applicability concerns graph (B).
Abbreviation: QUADAS-2, Quality Assessment of Diagnostic Accuracy Studies 2.
Quantitative data synthesis
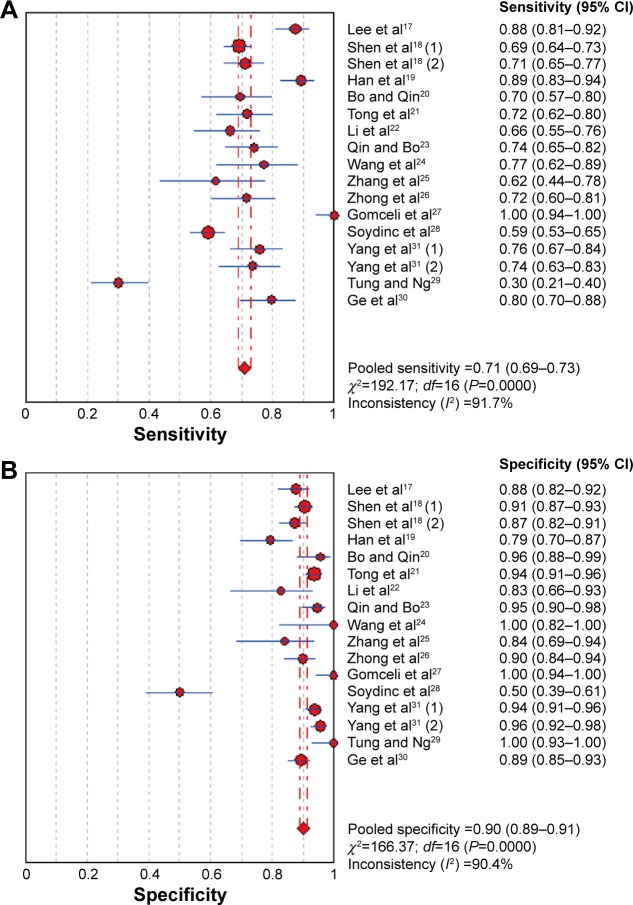
The pooled estimates of GI cancers for the diagnostic accuracy of serum DKK1 are presented in Table 2 and Figure 3. The pooled results of SEN, SPE, PLR, NLR, and DOR for DKK1 test were 0.72 (95% CI: 0.70–0.74), 0.90 (95% CI: 0.89–0.91), 7.72 (95% CI: 4.90–12.14), 0.29 (95% CI: 0.22–0.39), and 28.95 (95% CI: 16.25–51.65), respectively. The present study used Moses’ linear model to draw SROC curve, which summarized the joint distribution of SEN and
Table 2.
Summary of subgroup analysis of the included studies by different study characteristics
| Variables | Number of studies | SEN (95% CI) | SPE (95% CI) | PLR (95% CI) | NLR (95% CI) | DOR (95% CI) | AUC |
|---|---|---|---|---|---|---|---|
| Overall | 15 | 0.72 (0.70–0.74) | 0.90 (0.89–0.91) | 7.72 (4.90–12.14) | 0.29 (0.22–0.39) | 28.95 (16.25–51.65) | 0.8901 |
| Cancer type | |||||||
| HCC | 8 | 0.69 (0.66–0.71) | 0.92 (0.91–0.93) | 9.41 (7.38–12.00) | 0.32 (0.23–0.44) | 32.10 (23.79–43.30) | 0.8730 |
| GC | 3 | 0.87 (0.82–0.91) | 0.90 (0.86–0.93) | 7.84 (2.67–23.07) | 0.14 (0.03–0.61) | 72.35 (7.74–67.55) | 0.9479 |
| PC | 2 | 0.86 (0.81–0.91) | 0.83 (0.75–0.89) | 7.63 (1.14–50.96) | 0.18 (0.10–0.32) | 34.84 (17.07–71.09) | NA |
| Control origin | |||||||
| HC | 10 | 0.71 (0.69–0.73) | 0.92 (0.91–0.93) | 8.86 (6.84–11.48) | 0.29 (0.22–0.40) | 32.18 (24.57–42.14) | 0.9250 |
| Mixed | 5 | 0.71 (0.62–0.79) | 0.84 (0.81–0.87) | 8.47 (3.31–21.69) | 0.31 (0.20–0.49) | 32.74 (10.81–99.15) | 0.9028 |
| Sample size | |||||||
| ≥200 | 9 | 0.73 (0.70–0.75) | 0.90 (0.89–0.91) | 5.43 (3.65–8.06) | 0.31 (0.26–0.37) | 18.10 (11.00–29.78) | 0.8189 |
| <200 | 6 | 0.64 (0.59–0.68) | 0.95 (0.91–0.97) | 7.10 (4.06–12.42) | 0.28 (0.22–0.37) | 25.63 (12.64–51.95) | 0.8636 |
Abbreviations: SEN, sensitivity; CI, confidence interval; SPE, specificity; PLR, positive likelihood ratio; NLR, negative likelihood ratio; DOR, diagnostic odds ratio; AUC, area under curve; HCC, hepatocellular carcinoma; GC, gastric cancer; PC, pancreatic cancer; NA, nonavailable; HC, healthy control.
Figure 3.
Forest plot showing pooled sensitivity and specificity of DKK1 for diagnosis of GI cancers.
Note: (A) Sensitivity and (B) specificity.
Abbreviations: CI, confidence interval; DKK1, dickkopf-1; GI, gastrointestinal.
Heterogeneity assessment and subgroup analysis
All five performances showed high I2 value (SEN, 92.1%; SPE, 89.8%; PLR, 93.5%; NLR, 94.0%; and DOR, 90.6%) among the included studies, indicating that significant heterogeneity existed among the eligible studies. The Spearman correlation coefficient between the logic of SEN and the logic of 1 − SPE was −0.147 (P=0.561), indicating that the heterogeneity among eligible studies was not caused by the threshold effect. To access the heterogeneity between studies, subgroup analysis based on cancer type (HCC, GC, PC, and others), control origin (healthy controls or mixed controls), and sample size (≤200 or >200) was conducted.
The pooled SEN, SPE, PLR, NLR, and DOR for each subgroup are displayed in Table 2. We found that HCC subgroup had a pooled SEN of 0.69, SPE of 0.92, PLR of 9.41, NLR of 0.32, DOR of 32.10, and the area under curve (AUC) of 0.8730. For GC subgroup, the pooled SEN was 0.87, SPE was 0.90, PLR was 7.84, NLR was 0.14, DOR was 72.35, and the AUC was 0.9479. For PC subgroup, the pooled SEN was 0.86, SPE was 0.83, PLR was 7.63, NLR was 0.18, and DOR was 34.84. The SEN of DKK1 in diagnosis of GC and PC may be higher than HCC subgroup, and the SPE in PC subgroup was lower than HCC and GC subgroups. With respect to the difference between healthy controls and mixed controls (benign diseases and healthy controls), the SEN, SPE, and AUC for healthy control subgroup were 0.71, 0.80, and 0.9250, respectively, and for mixed control subgroup, the corresponding values were 0.71, 0.82, and 0.9028, providing additional evidences that DKK1 has similar diagnostic performance using different controls. We further performed an analysis based on the sample size. We found that small size subgroup (≤200) had higher diagnostic accuracy than that of large size subgroup, with a SEN of 0.64 versus 0.73, SPE of 0.95 versus 0.90, PLR of 11.23 versus 7.10, NLR of 0.33 versus 0.28, DOR of 42.57 versus 25.63, and AUC of 0.9616 versus 0.8636, which indicated that sample size may be an important influence factor for diagnosis of GI cancer.
Publication bias
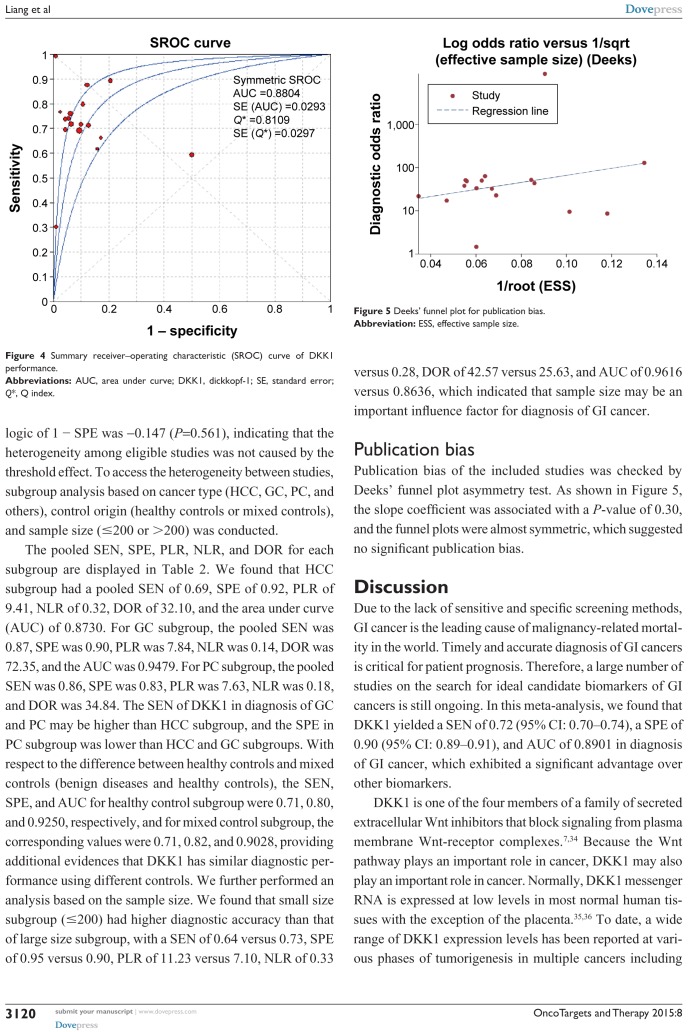
Publication bias of the included studies was checked by Deeks’ funnel plot asymmetry test. As shown in Figure 5, the slope coefficient was associated with a P-value of 0.30, and the funnel plots were almost symmetric, which suggested no significant publication bias.
Figure 5.
Deeks’ funnel plot for publication bias.
Abbreviation: ESS, effective sample size.
Discussion
Due to the lack of sensitive and specific screening methods, GI cancer is the leading cause of malignancy-related mortality in the world. Timely and accurate diagnosis of GI cancers is critical for patient prognosis. Therefore, a large number of studies on the search for ideal candidate biomarkers of GI cancers is still ongoing. In this meta-analysis, we found that DKK1 yielded a SEN of 0.72 (95% CI: 0.70–0.74), a SPE of 0.90 (95% CI: 0.89–0.91), and AUC of 0.8901 in diagnosis of GI cancer, which exhibited a significant advantage over other biomarkers.
DKK1 is one of the four members of a family of secreted extracellular Wnt inhibitors that block signaling from plasma membrane Wnt-receptor complexes.7,34 Because the Wnt pathway plays an important role in cancer, DKK1 may also play an important role in cancer. Normally, DKK1 messenger RNA is expressed at low levels in most normal human tissues with the exception of the placenta.35,36 To date, a wide range of DKK1 expression levels has been reported at various phases of tumorigenesis in multiple cancers including prostate, breast, colorectal, esophageal, lung, stomach, liver, and multiple myeloma.11,36–42 Previous studies have mainly focused on detecting DKK1 expression in tumor tissue by reverse-transcription PCR and immunohistochemical methods. Compared with serologic assay, however, the effectiveness of immunohistochemical assay is limited owing to poor objectivity and low quantitative analytic power. Therefore, determination of circulating DKK1 level in patients with cancers may provide a useful index of tissue DKK1 status, especially in light of the availability of relatively easy and inexpensive methods and the simplicity of sample collection.16 Recently, an increased serum DKK1 level has been reported to be useful as a biomarker in cancers. Although diagnostic role of DKK1 has not yet been well elucidated thus far, we performed a comprehensive meta-analysis and estimated the pooled accuracy of DKK1 for GI cancer detection.
Our data showed promising accuracy of serum DKK1 in diagnosing GI cancers, in which the overall pooled SEN was 0.72 and SPE was 0.90, with an AUC of 0.8901, suggesting that DKK1 achieved a relatively high accuracy for GI cancer detection. According to Hosmer and Lemeshow, the AUC between 0.80 and 0.90 can be regarded as “good”. However, the PLR value was 7.72, indicating that patients with GI cancers had a 7.72-fold higher chance of a positive DKK1 assay compared with patients without GI cancers. Similarly, the NLR indicated that, if the DKK1 assay was negative, the probability of these patients developing GI cancers was 29%. The DOR, as a single indicator measure of the accuracy of a diagnostic test,43 describes the odds of positive results in patients with the disease compared to the results in patients without disease. Thus, higher DOR values indicate better discriminatory test performance. The DOR in our study was 28.95, implying that DKK1 levels may be useful in diagnosing GI cancers.
Due to the significant heterogeneity, we conducted subgroup analysis based on the following variables such as cancer type, control origin, and sample size. Notably, our analysis based on cancer type showed that DKK1 yielded an overall SEN of 0.87, an overall SPE of 0.90, and AUC of 0.9479 for diagnosis of GC, suggesting that DKK1 may be a better biomarker in GC than HCC and PC. Moreover, in terms of control origin, HC control and mixed control subgroups yielded a similar SEN and AUC, implying that different control origins were not important influence factor for diagnosis of GI cancer. Additionally, subgroup analysis on the sample size showed that diagnostic performance in small size subgroup was better than large size subgroup, displaying that a large sample size might be more objective. Therefore, our results showed the existence of the link between DKK1 level and diagnosis of GI cancer. This is partly in accordance with some previous research. Considering this, it is highly possible that serum DKK1 could become a potential marker for the prediction of GI cancers.
Although we evaluated the diagnostic value of serum DKK1 on detecting GI cancers in this meta-analysis, there are inevitable limitations in interpreting our results. First, although all eligible studies were retrieved using different databases as thoroughly as possible, the sample sizes of the included studies were still insufficient, particularly for some subgroup analyses. Notably, the results of GC subgroup and PC subgroup analysis were pooled from three and two studies, respectively, and this could compromise the accuracy of the data. Second, considerable heterogeneity was found in the pooled estimates. The small number of studies and insufficient information does not allow further exploration of the source of heterogeneity. Some factors that may have contributed to this heterogeneity cannot be assessed or adjusted. Third, the studies with positive results are more easily to be published, and some relevant studies with negative results may be overlooked, which would affect the estimation of the pooled diagnostic accuracy.
Conclusion
The currently available evidence suggests that serum DKK1 is a potential biomarker with high SEN and SPE for screening GI cancers. However, further observations are needed due to the limitations of this study described earlier.
Figure 4.
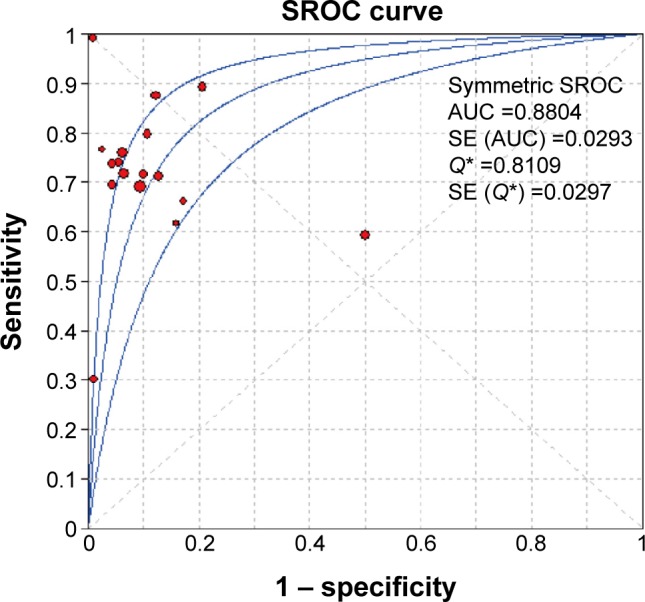
Summary receiver–operating characteristic (SROC) curve of DKK1 performance.
Abbreviations: AUC, area under curve; DKK1, dickkopf-1; SE, standard error; Q*, Q index.
Footnotes
Disclosure
The authors declare that they have no competing interests in this work.
References
- 1.Jemal A, Bray F, Center MM, Ferlay J, Ward E, Forman D. Global cancer statistics. CA Cancer J Clin. 2011;61(2):69–90. doi: 10.3322/caac.20107. [DOI] [PubMed] [Google Scholar]
- 2.Siegel R, Naishadham D, Jemal A. Cancer statistics, 2012. CA Cancer J Clin. 2012;62(1):10–29. doi: 10.3322/caac.20138. [DOI] [PubMed] [Google Scholar]
- 3.Singh M, Harris-Birtill DC, Markar SR, Hanna GB, Elson DS. Application of gold nanoparticles for gastrointestinal cancer theranostics: a systematic review. Nanomedicine. 2015 Jun 23; doi: 10.1016/j.nano.2015.05.010. Epub. [DOI] [PubMed] [Google Scholar]
- 4.Cui J, Shi M, Quan M, Xie K. Regulation of EMT by KLF4 in gastrointestinal cancer. Curr Cancer Drug Targets. 2013;13(9):986–995. doi: 10.2174/15680096113136660104. [DOI] [PMC free article] [PubMed] [Google Scholar]
- 5.Tao YM, Liu Z, Liu HL. Dickkopf-1 (DKK1) promotes invasion and metastasis of hepatocellular carcinoma. Dig Liver Dis. 2013;45(3):251–257. doi: 10.1016/j.dld.2012.10.020. [DOI] [PubMed] [Google Scholar]
- 6.Niida A, Hiroko T, Kasai M, et al. DKK1, a negative regulator of Wnt signaling, is a target of the beta-catenin/TCF pathway. Oncogene. 2004;23(52):8520–8526. doi: 10.1038/sj.onc.1207892. [DOI] [PubMed] [Google Scholar]
- 7.Glinka A, Wu W, Delius H, Monaghan AP, Blumenstock C, Niehrs C. Dickkopf-1 is a member of a new family of secreted proteins and functions in head induction. Nature. 1998;391(6665):357–362. doi: 10.1038/34848. [DOI] [PubMed] [Google Scholar]
- 8.Kaba M, Pirincci N, Benli E, et al. Dickkopf-1 levels in Turkish patients with bladder cancer and its association with clinicopathological features. Asian Pac J Cancer Prev. 2014;15(1):381–384. doi: 10.7314/apjcp.2014.15.1.381. [DOI] [PubMed] [Google Scholar]
- 9.Li S, Qin X, Guo X, et al. Dickkopf-1 is oncogenic and involved in invasive growth in non small cell lung cancer. PLoS One. 2013;8(12):e84944. doi: 10.1371/journal.pone.0084944. [DOI] [PMC free article] [PubMed] [Google Scholar]
- 10.Xu WH, Liu ZB, Yang C, Qin W, Shao ZM. Expression of Dickkopf-1 and beta-catenin related to the prognosis of breast cancer patients with triple negative phenotype. PLoS One. 2012;7(5):e37624. doi: 10.1371/journal.pone.0037624. [DOI] [PMC free article] [PubMed] [Google Scholar]
- 11.Gao C, Xie R, Ren C, Yang X. Dickkopf-1 expression is a novel prognostic marker for gastric cancer. J Biomed Biotechnol. 2012;2012:804592. doi: 10.1155/2012/804592. [DOI] [PMC free article] [PubMed] [Google Scholar]
- 12.Thudi NK, Martin CK, Murahari S, et al. Dickkopf-1 (DKK-1) stimulated prostate cancer growth and metastasis and inhibited bone formation in osteoblastic bone metastases. Prostate. 2011;71(6):615–625. doi: 10.1002/pros.21277. [DOI] [PMC free article] [PubMed] [Google Scholar]
- 13.Heider U, Kaiser M, Mieth M, et al. Serum concentrations of DKK-1 decrease in patients with multiple myeloma responding to anti-myeloma treatment. Eur J Haematol. 2009;82(1):31–38. doi: 10.1111/j.1600-0609.2008.01164.x. [DOI] [PubMed] [Google Scholar]
- 14.Rachner TD, Thiele S, Göbel A, et al. High serum levels of Dickkopf-1 are associated with a poor prognosis in prostate cancer patients. BMC Cancer. 2014;14:649. doi: 10.1186/1471-2407-14-649. [DOI] [PMC free article] [PubMed] [Google Scholar]
- 15.Zhou SJ, Zhuo SR, Yang XQ, Qin CX, Wang ZL. Serum Dickkopf-1 expression level positively correlates with a poor prognosis in breast cancer. Diagn Pathol. 2014;9:161. doi: 10.1186/s13000-014-0161-4. [DOI] [PMC free article] [PubMed] [Google Scholar]
- 16.Sheng SL, Huang G, Yu B, Qin WX. Clinical significance and prognostic value of serum Dickkopf-1 concentrations in patients with lung cancer. Clin Chem. 2009;55(9):1656–1664. doi: 10.1373/clinchem.2009.125641. [DOI] [PubMed] [Google Scholar]
- 17.Lee HS, Lee HE, Park do J, Kim HH, Kim WH, Park KU. Clinical significance of serum and tissue Dickkopf-1 levels in patients with gastric cancer. Clin Chim Acta. 2012;413(21–22):1753–1760. doi: 10.1016/j.cca.2012.07.003. [DOI] [PubMed] [Google Scholar]
- 18.Shen Q, Fan J, Yang XR, et al. Serum DKK1 as a protein biomarker for the diagnosis of hepatocellular carcinoma: a large-scale, multicentre study. Lancet Oncol. 2012;13(8):817–826. doi: 10.1016/S1470-2045(12)70233-4. [DOI] [PubMed] [Google Scholar]
- 19.Han SX, Zhou X, Sui X, et al. Serum Dickkopf-1 is a novel serologi cal biomarker for the diagnosis and prognosis of pancreatic cancer. Oncotarget. 2015;6(23):19907–19917. doi: 10.18632/oncotarget.4529. [DOI] [PMC free article] [PubMed] [Google Scholar]
- 20.Bo WB, Qin J. Diagnostic value of combined detection of AFP, AFP-L3, DKK1 in primary hepatic carcinoma. Int J Lab Med. 2014;35(20):2765–2768. [Google Scholar]
- 21.Tong HB, Ting YJ, Duan K. Value of alpha fetoprotein, Dickkopf1 glycoprotein and α-L-fucosidase in early diagnosis of liver cancer. World Chin J Dig. 2014;22(24):3670–3674. [Google Scholar]
- 22.Li BB, Li D, Liu SG. Expression of serum DKK-1 in esophageal cancer. J Shandong Univ Health Sci. 2009;47(6):58–61. [Google Scholar]
- 23.Qin JB, Bo W. Combined detection of AFP, TK1 and DKK1 in diagnosis of primary hepatocellular carcinoma. Chin J Clin Lab Sci. 2014;32(7):545–547. [Google Scholar]
- 24.Wang QW, Wang Q, Li DP. Detection of Dkk1 in pancreatic cancer and its clinical significance. J Bengbu Med Coll. 2014;39(6):718–720. [Google Scholar]
- 25.Zhang XG, Zhong L, Liu Q. Clinical value of Dkk1 in serum and tissue in patients with gastric cancer. Shandong Med. 2010;50(19):74–75. [Google Scholar]
- 26.Zhong YY, Xu H, Xu W. Evaluation on the diagnostic significance of Dkk1, GP73 and AFP in primary HCC by logisitic regression analysis. Lab Med. 2015;30(6):559–563. [Google Scholar]
- 27.Gomceli I, Bostanci EB, Ozer I, et al. A novel screening biomarker in gastric cancer: serum Dickkopf-1. Hepatogastroenterology. 2012;59(117):1661–1664. doi: 10.5754/hge11516. [DOI] [PubMed] [Google Scholar]
- 28.Soydinc HO, Duranyildiz D, Camlica H, Oral EN, Yasasever V. Lack of diagnostic potential of Dickkopf-1 in colon and rectum cancers. Asian Pac J Cancer Prev. 2011;12(12):3187–3189. [PubMed] [Google Scholar]
- 29.Tung EK, Ng IO. Significance of serum DKK1 as a diagnostic biomarker in hepatocellular carcinoma. Future Oncol. 2012;8(12):1525–1528. doi: 10.2217/fon.12.147. [DOI] [PubMed] [Google Scholar]
- 30.Ge T, Shen Q, Wang N, et al. Diagnostic values of alpha-fetoprotein, Dickkopf-1, and osteopontin for hepatocellular carcinoma. Med Oncol. 2015;32(3):59. doi: 10.1007/s12032-014-0367-z. [DOI] [PubMed] [Google Scholar]
- 31.Yang H, Chen GD, Fang F, et al. Dickkopf-1: as a diagnostic and prognostic serum marker for early hepatocellular carcinoma. Int J Biol Markers. 2013;28(3):286–297. doi: 10.5301/jbm.5000015. [DOI] [PubMed] [Google Scholar]
- 32.Deeks JJ. Systematic reviews in health care: systematic reviews of evaluations of diagnostic and screening tests. BMJ. 2001;323(7305):157–162. doi: 10.1136/bmj.323.7305.157. [DOI] [PMC free article] [PubMed] [Google Scholar]
- 33.Niehrs C. Function and biological roles of the Dickkopf family of Wnt modulators. Oncogene. 2006;25(57):7469–7481. doi: 10.1038/sj.onc.1210054. [DOI] [PubMed] [Google Scholar]
- 34.Forget MA, Turcotte S, Beauseigle D, et al. The Wnt pathway regulator DKK1 is preferentially expressed in hormone-resistant breast tumours and in some common cancer types. Br J Cancer. 2007;96(4):646–653. doi: 10.1038/sj.bjc.6603579. [DOI] [PMC free article] [PubMed] [Google Scholar]
- 35.Qian J, Xie J, Hong S, et al. Dickkopf-1 (DKK1) is a widely expressed and potent tumor-associated antigen in multiple myeloma. Blood. 2007;110(5):1587–1594. doi: 10.1182/blood-2007-03-082529. [DOI] [PMC free article] [PubMed] [Google Scholar]
- 36.Aguilera Ó, González-Sancho JM, Zazo S, et al. Nuclear DICKKOPF-1 as a biomarker of chemoresistance and poor clinical outcome in colorectal cancer. Oncotarget. 2015;6(8):5903–5917. doi: 10.18632/oncotarget.3464. [DOI] [PMC free article] [PubMed] [Google Scholar]
- 37.Hall CL, Daignault SD, Shah RB, Pienta KJ, Keller ET. Dickkopf-1 expression increases early in prostate cancer development and decreases during progression from primary tumor to metastasis. Prostate. 2008;68(13):1396–1404. doi: 10.1002/pros.20805. [DOI] [PMC free article] [PubMed] [Google Scholar]
- 38.Voorzanger-Rousselot N, Goehrig D, Journe F, et al. Increased Dickkopf-1 expression in breast cancer bone metastases. Br J Cancer. 2007;97(7):964–970. doi: 10.1038/sj.bjc.6603959. [DOI] [PMC free article] [PubMed] [Google Scholar]
- 39.Makino T, Yamasaki M, Takemasa I, et al. Dickkopf-1 expression as a marker for predicting clinical outcome in esophageal squamous cell carcinoma. Ann Surg Oncol. 2009;16(7):2058–2064. doi: 10.1245/s10434-009-0476-7. [DOI] [PubMed] [Google Scholar]
- 40.Xiang XJ, Liu YW, Chen DD, Yu S. Differential expression of Dickkopf-1 among non-small cell lung cancer cells. Mol Med Rep. 2015;12(2):1935–1940. doi: 10.3892/mmr.2015.3654. [DOI] [PubMed] [Google Scholar]
- 41.Huang Y, Yang X, Zhao F, et al. Overexpression of Dickkopf-1 predicts poor prognosis for patients with hepatocellular carcinoma after orthotopic liver transplantation by promoting cancer metastasis and recurrence. Med Oncol. 2014;31(7):966. doi: 10.1007/s12032-014-0966-8. [DOI] [PubMed] [Google Scholar]
- 42.Glas AS, Lijmer JG, Prins MH, Bonsel GJ, Bossuyt PM. The diagnostic odds ratio: a single indicator of test performance. J Clin Epidemiol. 2003;56(11):1129–1135. doi: 10.1016/s0895-4356(03)00177-x. [DOI] [PubMed] [Google Scholar]


