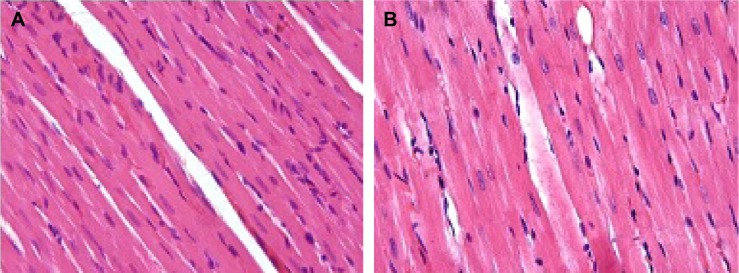
Figure 1.

Appearance of heart tissue in control groups.
Notes: C1 (A) and C2 (B) groups. Both had normal heart structure and there were no lesions. H&E staining; magnification ×40.
Abbreviations: C1, control group for acute varenicline treatment; C2, control group for chronic varenicline treatment; H&E, hematoxylin and eosin.
