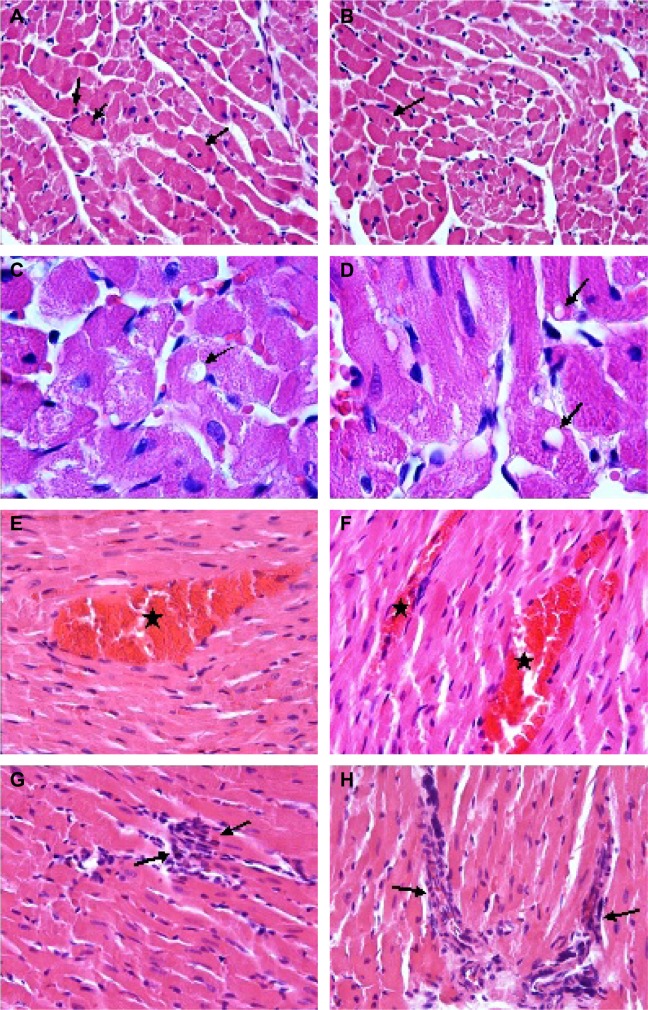
Figure 2.
Effect of varenicline treatment.
Notes: V1 (A) and V2 (B) groups: appearance of the cytoplasm of cardiomyocytes was eosinophilic and with darker nuclei (arrows); H&E staining; magnification ×40. V1 (C) and V2 (D) groups: some of the cardiomyocytes showed intracytoplasmic vacuoles (arrows). H&E staining; magnification ×100. V1 (E) and V2 (F) groups: notice the interstitial congestion (stars). H&E staining; magnification ×40. V1 (G) and V2 (H) groups: visible inflammatory cell infiltration between cardiomyocytes (arrows). H&E staining; magnification ×40.
Abbreviations: V1, acute varenicline treatment group; V2, chronic varenicline treatment group; H&E, hematoxylin and eosin.

