
Figure 1.
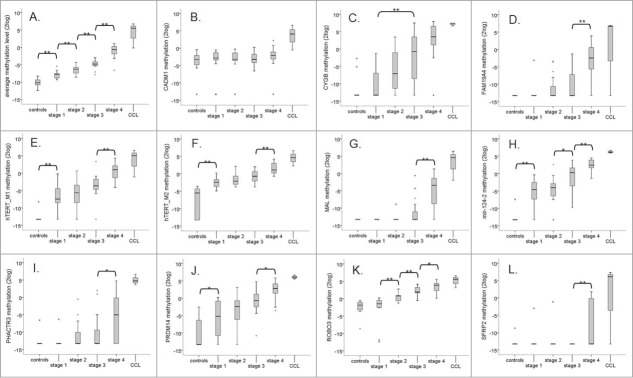
Progressive increase in DNA methylation levels. (A) Box-plot of the average methylation level of all 14 genes (APC, CADM1, CYGB, FAM19A4, hTERT, mir124–1, mir124–2, mir124–3, MAL, PHACTR3, PRDM14, RASSF1A, ROBO3, and SFRP2) per stage. (B–L) Boxplots of the methylation levels of the individual genes per stage. Only genes that became methylated in at least one stage are shown (CADM1 (B), CYGB (C), FAM19A4 (D), hTERT M1 (E), hTERT M2 (F), MAL (G), mir124–2 (H), PHACTR3 (I), PRDM14 (J), ROBO3 (K), and SFRP2 (L)). * P < 0.05, ** P < 0.01.