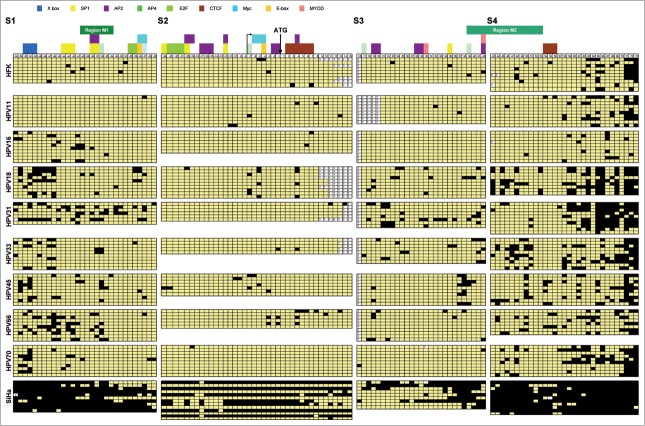
Figure 3.
Bisulfite sequencing results of the hTERT CpG island. Overview of the CpG methylation results of individual cloned PCR products of untransduced HFKs, HPV11- and stage 3 HPV16-, 18-, 31-, 33-, 45-, 66- and 70-transduced HFKs of donor I of 4 regions: S1 spanning −476 to −185 bp, S2 spanning −209 to +96 bp, S3 spanning +90 to +338 bp and S4 spanning +319 to 600 bp relative to the ATG. Numbers refer to the respective CpG and their position relative to the ATG. The position of known and putative transcription factor binding sites are plotted on top of the corresponding CpG. Regions analyzed by qMSP (M1 and M2) are plotted on top of the appropriate CpG in green. Black indicates methylation positive; yellow indicates methylation negative; ? indicates no sequencing results available.

