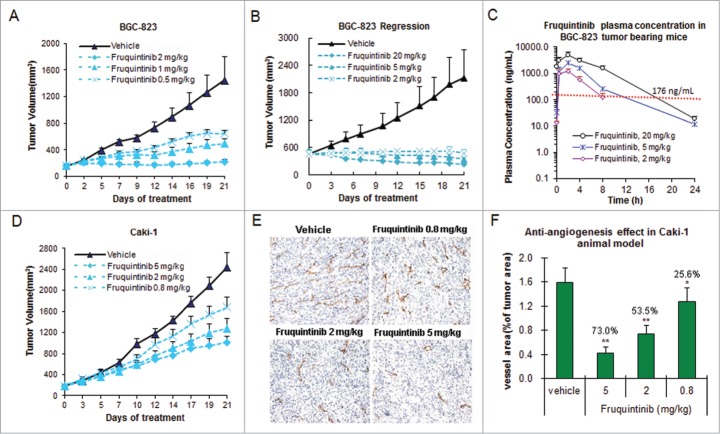
Figure 5.
Fruquintinib inhibited BGC-823 and Caki-1 tumor growth and anti-angiogenesis in tumor tissues. (A) Dose-dependent tumor growth inhibition in BGC-823 tumor following once daily oral treatment of fruquintinib at 0.5, 1 and 2 mg/kg. (B) Anti-tumor effect of fruquintinib at 2, 5 and 20 mg/kg in BGC-823. BGC-823 tumor was regressed by fruquintinib at 5 and 20 mg/kg. (C) Plasma exposures of fruquintinib at 2, 5 and 20 mg/kg in BGC-823 tumor bearing mice following consecutive oral daily dosing. The red line indicated the plasma EC85 for p-KDR inhibition in nude mouse. (D) Dose-dependent tumor growth inhibition in Caki-1 tumor model. (E) CD31 immunohistochemistry staining in Caki-1 xenografts. The pictures were taken at 200× magnification under microscope. Vascular vessels were stained as brown, representing the tumor angiogenesis. (E) Semi-quantification of IHC image. The percentage of CD31 positive area to tumor area was analyzed with NIKON BR-3.0 software. *P < 0.05, **P < 0.01 compared with vehicle group.

