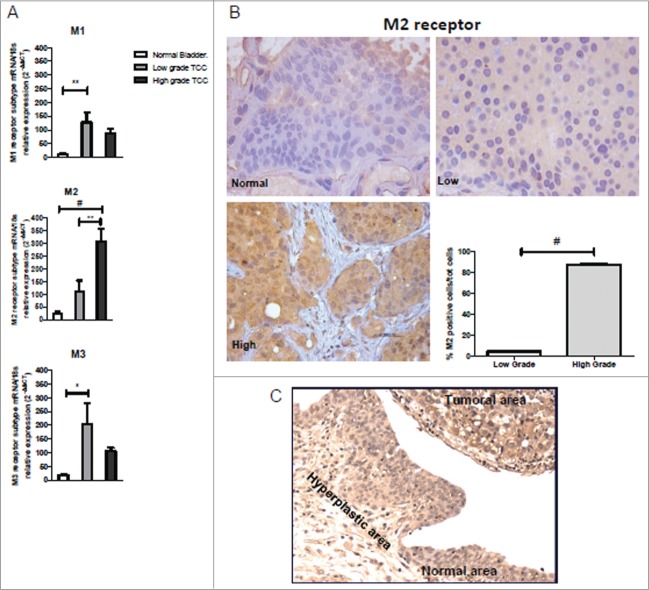
Figure 1.
Muscarinic receptor expression in bladder cancer biopsies. (A) M1, M2 and M3 mRNA expression levels in normal bladder and in low and high TCC grade. mRNA levels for M1 and M3 receptor subtype were significantly upregulated only in low-grade tumor tissues compared to controls, differently from mRNA levels for M2 subtype receptor whose expression in the high-grade tumors was statistically significant increased than both in normal tissue and low-grade tumors (B) Immunohistochemistry analysis for M2 receptor expression. M2 expression in normal, low, and high TCC grade (40×). The graph shows the quantification of the percentage of the M2 positive cells in high and low TCC grade. (C) Immunohistochemistry analysis showing the M2 receptor expression in the normal and transitional area nearby the tumoral region. Magnification 20×. *P < 0.05, **P < 0.01, #P < 0.001.

