Figure 6.
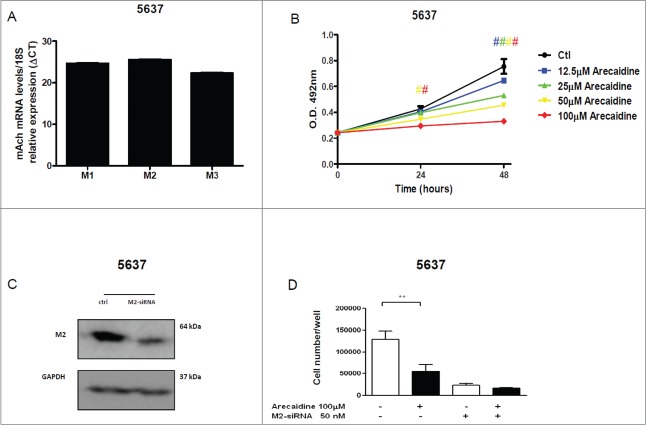
The M2 agonist Arecaidine inhibits in vitro cell proliferation of 5637 cell line. (A) M1, M2 and M3 mRNA expression levels in 5637 cell line. (B) MTS assay of 5637 cell proliferation in absence (control) or in presence of Arecaidine (12.5, 25, 50, 100 μM) for 24 and 48 hrs where cell survival was significantly decreased in a dose-dependent manner after both 24 and 48 hrs of treatment with Arecaidine. (C) Representative images of Western blot of M2 receptor expression in 5637 cells in absence and in presence of M2-siRNA pool (after 48 hrs of transfection). GAPDH was used to normalize the bands. (D) MTS analysis (reported as N. of cells) performed in 5637 cell line after 48 hrs of siRNA transfection and additional 48 hrs of Arecaidine (100 μM) treatment. The values are the mean ± SEM of 2 independent experiments performed in triplicate. #P < 0.001. Ctl, control. O.D., optical density.

