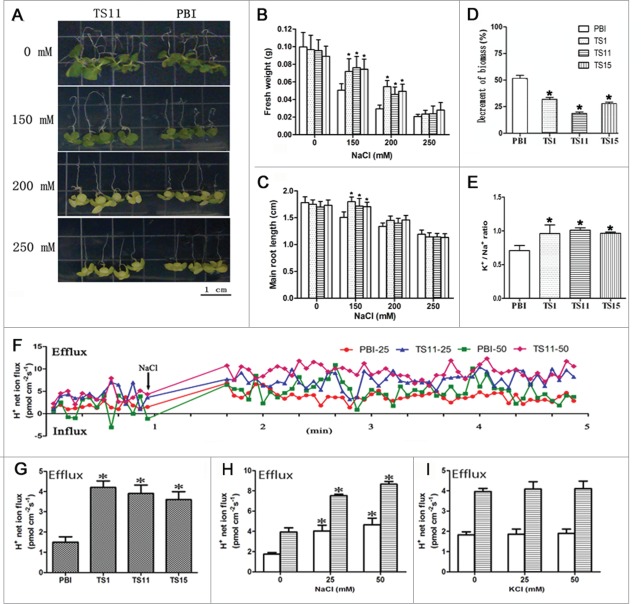
Figure 1.
Analysis of vacuole net H+ fluxes and NaCl tolerance of SeNHX1 transgenic tobaccos. A to C, Phenotype changes (A), and fresh weights (B), and root lengths (C) of 6-day-old seedlings after 0 (MS), 150, 200 or 250 mM NaCl treatment for 12 d. Data are means ± SE (n = 3 plates, 4 seedlings in each plate). D-E, Effect of 200 mM NaCl on biomass (D) and K+/Na+ ratio (E) of PBI-type and 3 transgenic lines (TS1, TS11 and TS15) subjected to 200 mM NaCl for 6 weeks. Data are means ± SE (n = 6 seedlings). F, Time-course dynamic curves of vacuolar net H+ fluxes under different concentrations of NaCl shock. PBI-25/50 represents vacuoles of PBI-type plants under 25 mM or 50 mM NaCl shock, respectively. TS11-25/50 represents vacuoles of TS11 plants under 25 mM or 50 mM NaCl shock, respectively. G to I, Mean net H+ fluxes in vacuoles for 12 min test under normal condition (G), and supplied with 0, 25 and 50 mM NaCl (H) or KCl (I). The value obtained from NMT indicates net ion flux, the positive values of ion flux in figures represent cation efflux or anion influx and vice versa. Data are means ± SE (n = 6 vacuoles from 6 independent transgenic lines). PBI means tobacco plants transformed with pBI121 empty vector. TS1, TS11, and TS15 represent T1 progenies of SeNHX1 transgenic tobacco lines. Asterisks on bars indicate significant differences from PBI-type plants (difference from untreated plants in H and I) under the same treatment at P ≤ 0.05.

