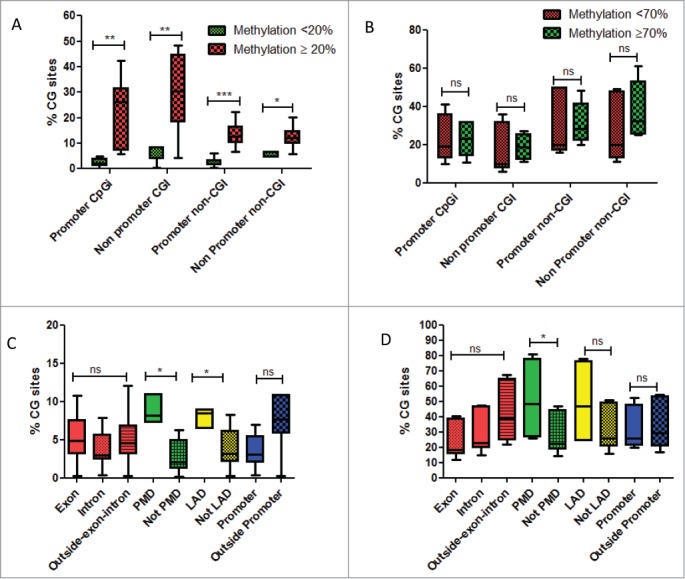
Figure 3.

(A) Box-plots of percentage of CG sites covered by DREAM method and gaining DNA methylation, whether located in promoters or outside promoters according to their methylation levels in normal livers. Green is related to CG sites with methylation level < 20% in normal liver. Red is related to CG sites with methylation level ≥ 20% in normal liver. (B) Box-plots of percentage of CG sites covered by DREAM method and losing DNA methylation, whether located in promoters or outside promoters according to their methylation levels in normal livers. Green is related to CG sites with methylation level < 70% in normal liver. Red is related to CG sites with methylation level ≥ 70 % in normal liver. (C) Box-plots of percentage of CG sites gaining DNA methylation, according to different genomic regions. (D) Box-plots of percentage of CG sites losing DNA methylation, according to different genomic regions. Abbreviations: PMD: partially methylated domains; LAD: lamina associated domains. For statistical analysis: ns: non significant; *P-value < 0.05; **P-value < 0.001; ***P-value < 0.0001.
