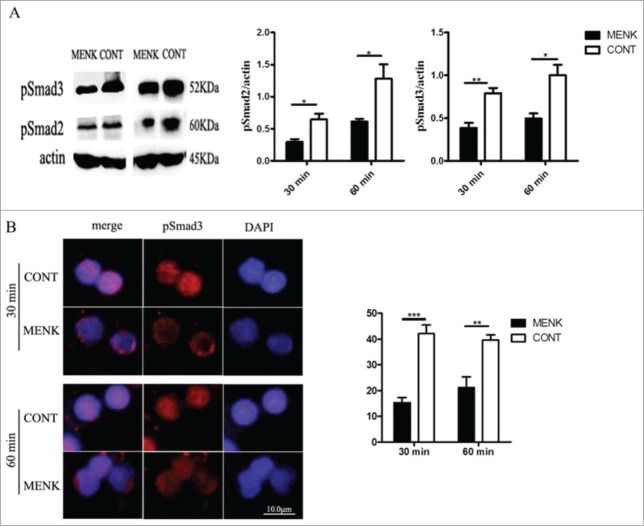
Figure 3.
MENK inhibited Treg cells by affecting the phosphorylation and nuclear translocation of Smad2/3. (A),WB for analysis of phosphorylated Smad2/3. Band intensities were quantified using Quantity One version4.6.2 software. (B), The slides of cells were incubated with anti-phospho-Smad3 (1:200), and examined by Fluorescence Microscope with Digital CCD Imaging System. Analysis was done with ImageJ software. The data were representative of 3 separate experiments with similar results. The concentration for MENK treatment was 10−12 M. Data was presented as the mean±SD. *P < 0.05; **P < 0.01 vs. the RPMI 1640 group

