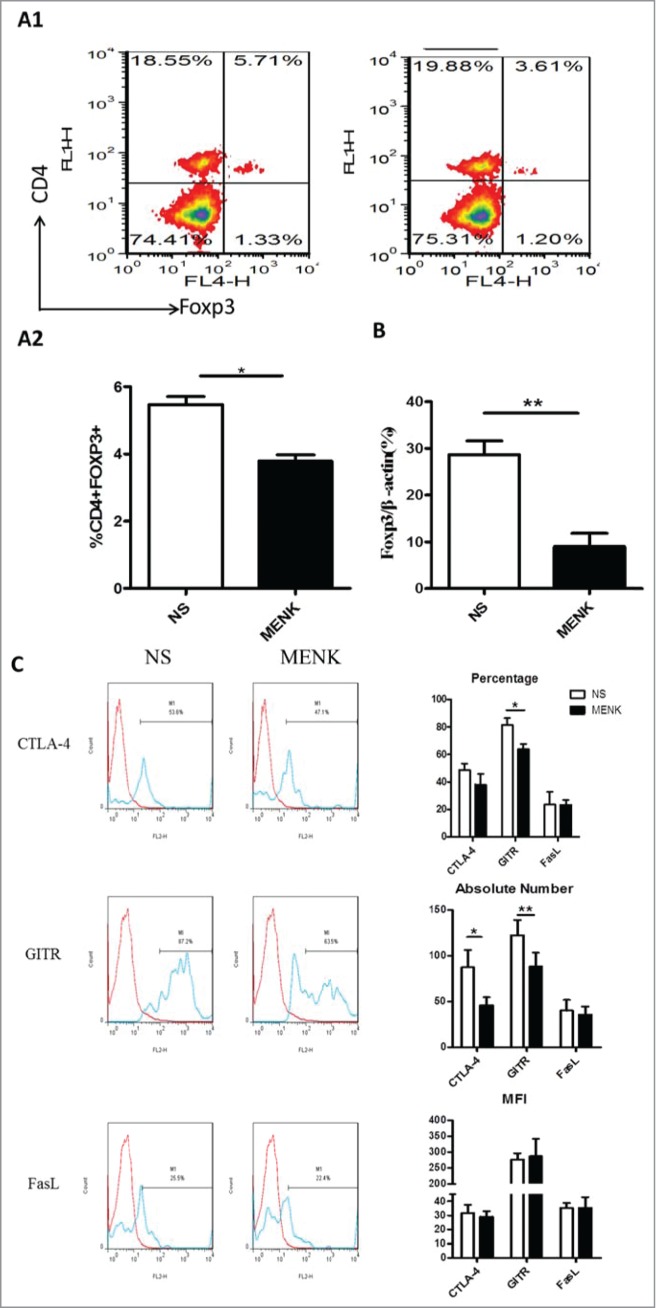
Figure 5.

MENK suppressed splenic CD4+Foxp3+ Treg cells in S180 model mice. (A1 and A2), Isolated splenocytes were stained with anti-CD4 (FITC) and anti-Foxp3 (APC) and submitted to FCM analysis. (B), The mRNA level of Foxp3 in splenocytes of both groups. (C), The cells were gated on CD4+Foxp+ and analyzed for CTLA-4, GITR and FasL- positive cells, respectively. Data was analysis by FCS Express and Flowjo software. The red line was the isotype control staining; the blue line indicated specific staining mentioned above. The data were representative of at least 3 independent experiments with similar results and were presented as the mean±SD. *P < 0.05; **P < 0.01 vs. that in control group (NS group) as determined by Student's t test.
