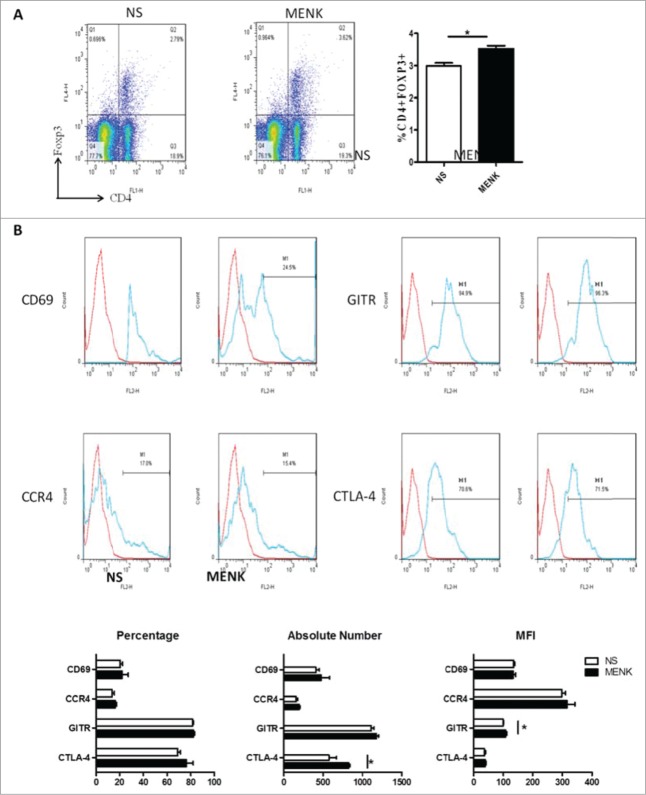
Figure 6.
(A), Collected lymphocytes from tumor draining lymph nodes (TDLN) were stained with anti-CD4 (FITC) and anti-Foxp3 (APC) and submitted to FCM. (B), CD4+Foxp3+ cells were gated on and analyzed forCTLA-4, GITR, CCR4 and CD69- positive cells, respectively. The red line was the isotype control staining; the blue line indicated specific staining. The data are one representative of 3 separate experiments with similar results. Data were presented as the mean±SD. *P < 0.05 versus that in control group (CONT group) as determined by Student's t test.

