Figure 6.
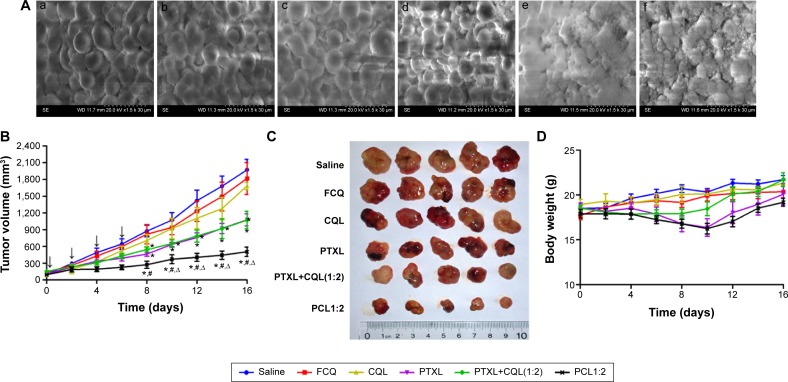
Scanning electron microscope images of A549/T MTS treated with various formulations and in vivo antitumor efficacy of different formulations on nude mice bearing A549/T after intravenous administration.
Notes: (A) Scanning electron microscope images of A549/T MTS treated with (a) phosphate-buffered saline, (b) PTXL, (c) CQL, (d) PCL1:0.5, (e) PCL1:2, and (f) PCL1:5 for 24 hours (magnification ×1.5 k). The concentration of PTX in all PTX preparations was 3 µg/mL, while the concentration of CQ and CQL was 15 µg/mL. In vivo antitumor efficacy assay was performed four times at the dose of 20 mg/kg PTX and/or 40 mg/kg CQ. (B) Change in tumor volume of mice after injection. (C) Tumor size was photographed at the end of the experiment; n=5 for each group. (D) Change in body weight of mice after injection. Data are presented as the mean ± standard error of the mean. n=5. *P<0.01 versus the saline group; #P<0.05 versus the PTXL+CQL(1:2) group; ∆P<0.05 versus the PTXL group.
Abbreviations: CQ, chloroquine phosphate; CQL, CQ-loaded liposome; FCQ, free CQ; MTS, multicellular tumor spheroids; PCL, liposome co-encapsulating PTX and CQ; PCL1:0.5, PCL with PTX and CQ at a weight ratio of 1:0.5; PCL1:2, PCL with PTX and CQ at a weight ratio of 1:2; PCL1:5, PCL with PTX and CQ at a weight ratio of 1:5; PTX, paclitaxel; PTXL, PTX-loaded liposome; PTXL+CQL(1:2), the mixture of PTXL and CQL at a weight ratio of 1:2; SE, secondary electron detector; WD, working distance.

