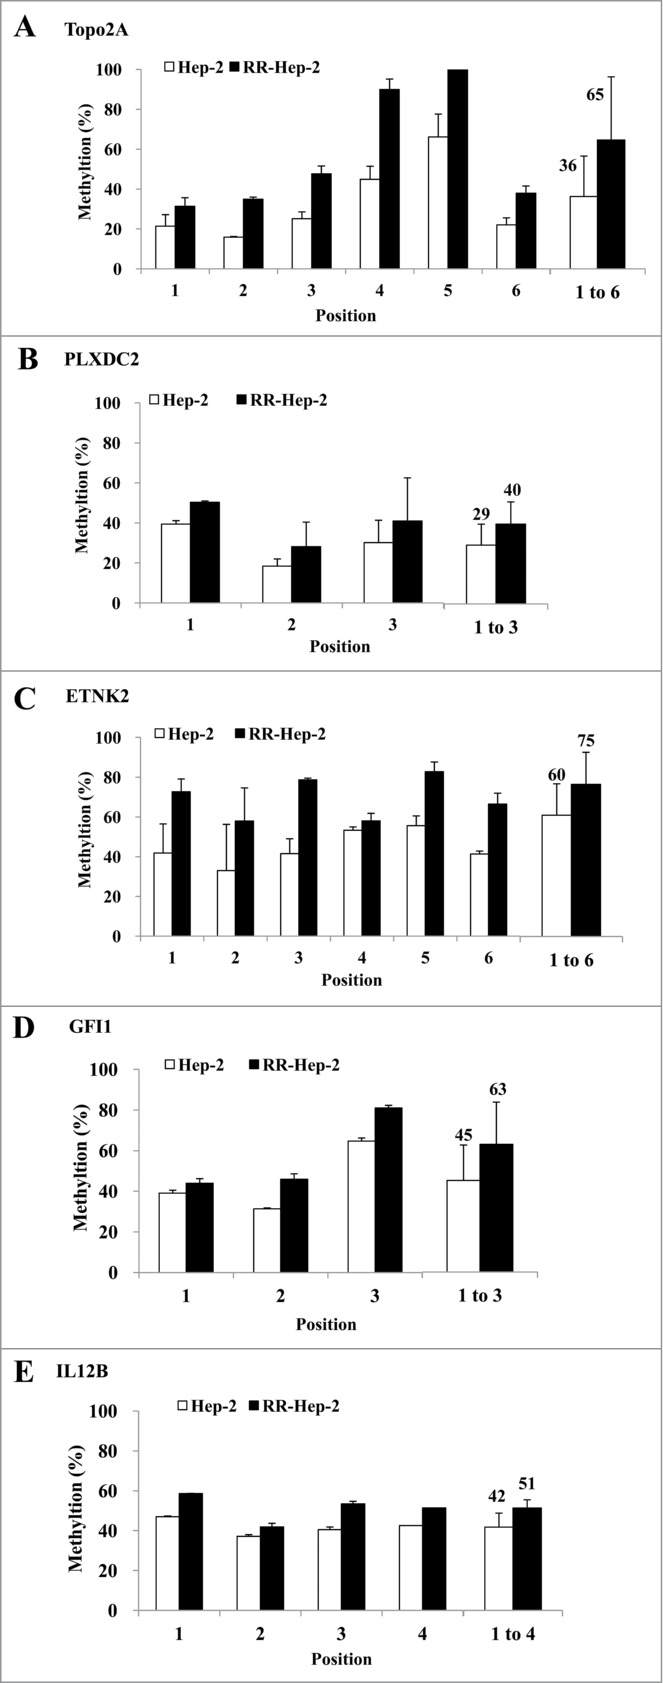
Figure 2.

Pyrosequencing of promoter CpG islands in the promoters of 5 radioresistance-related genes in Hep-2 and RR-Hep-2 cells. The fractions of methylated CpG positions were compared between cell lines for (A) TOPO2A, (B) PLXDC2, (C) ETNK2, (D) GFI1 and (E) IL12B. The bars on the far right represent the means of all the methylated positions examined herein. The data presented represent a typical result or average values with standard deviations from 3 independent experiments.
