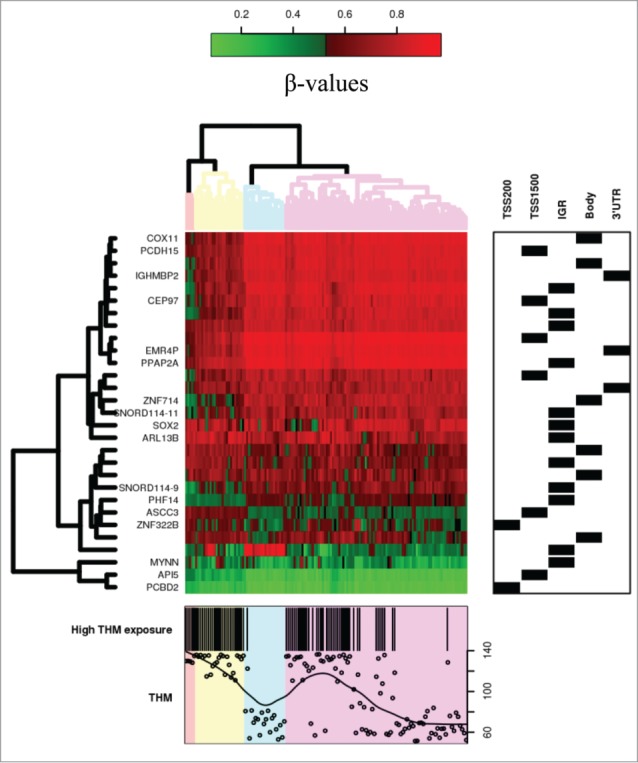
Figure 2.

Heatmap of CpG sites with methylation levels associated with THM exposure (|Δβ|>0.05 and FDR<0.05). Note: DNA methylation heatmap of methylated genes passing FDR<0.05, in white blood cells DNA of persons exposed during lifetime to trihalomethanes. Each row represents a CpG site with columns representing each sample. The top dendrogram shows the results of an unsupervised hierarchical clustering of 138 samples based on 29 CpG sites, which separates those subjects flagged as highly exposed in average to lifetime THM levels >85 μg/L (marked as black in the bottom box), from those exposed to lower levels (the remainder columns). In the right box each site is marked to its corresponding region. A scatterplot of the actual lifetime THM levels is shown at the bottom box.
