
Figure 1.
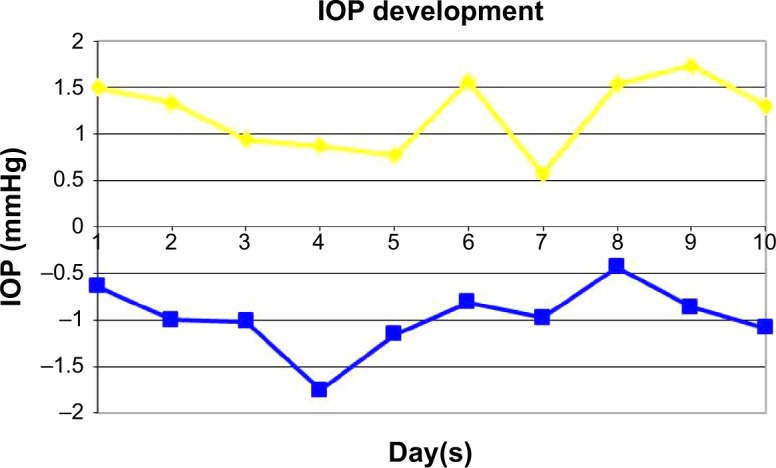
Mean change from baseline in IOP (mmHg) during the 10-day core study phase (differences in IOP between before and after daily treatment).
Notes: Blue line = TG; yellow line = CG. Copyright © 2009. Reproduced with friendly permission from Bertelmann T. Musiktherapie für Glaukompatienten. Adjuvante Glaukomtherapie. Saarbrücken: Südwestdeutscher Verlag für Hochschulschriften; 2009. German.62
Abbreviations: IOP, intraocular pressure; TG, therapy group; CG, control group.