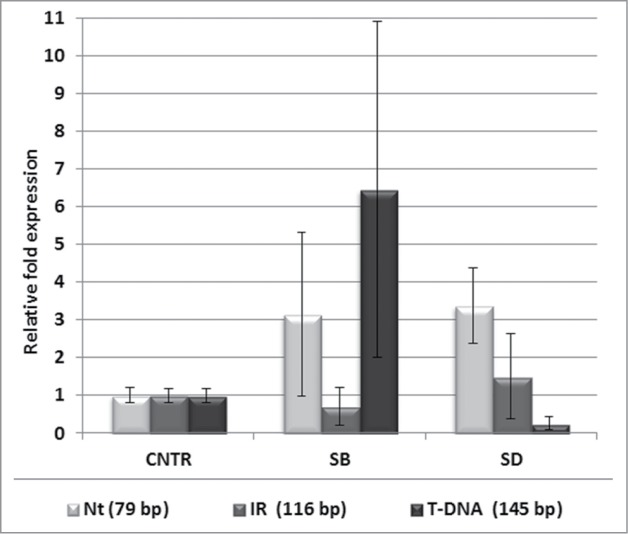
Figure 4.

Stress-dependent changes of the relative abundance of 2 variants of NBR1 transcript in SALK_135513 plants. Localization of the PCR product specific for SALK_135513 WT (Nt, 145 bp; IR, 116 and T-DNA, 145 bp) transcripts is as in Fig. 3A. The amounts of the indicated PCR products in SALK_135513 plants treated by salt stress (SB) and drought stress (SD) is shown in relation to the amount of the same products in SALK_135513 plants grown in the control conditions (CNTR). Data bars represent the mean (±SD) of 2 biological repeats performed in technical duplicate.
