
Figure 4.
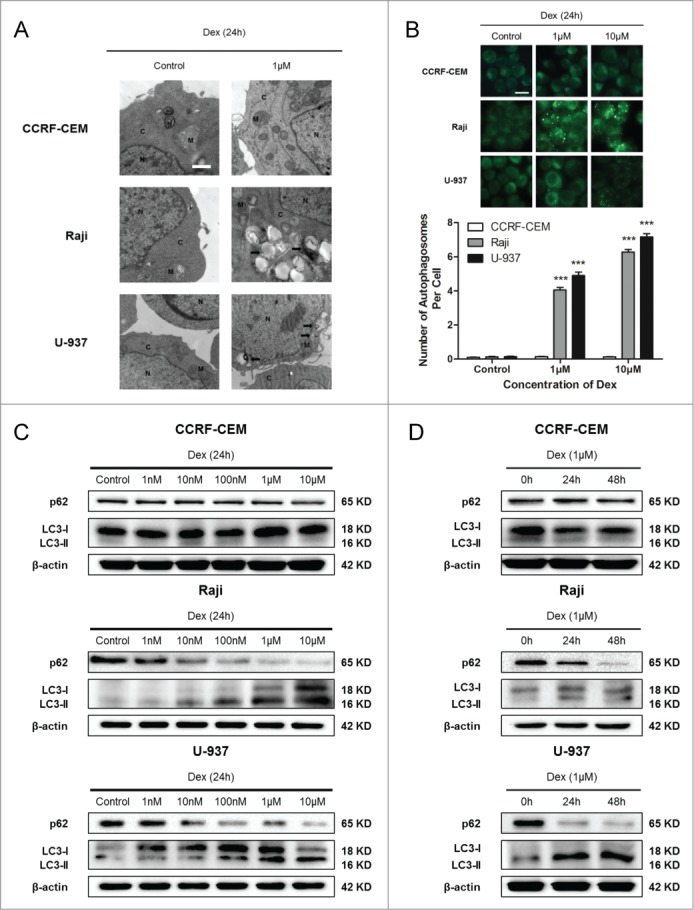
Dex induces autophagy in both Raji and U-937 cells. (A) CCRF-CEM, Raji, and U-937 cells were treated with 0 and 1 μM Dex for 24 h, and autophagosome formation was evaluated by transmission electron microscopy. M indicates mitochondrial structures, N the nucleus, C the cytoplasm, and arrowheads indicate autophagosomes. Scale bar: 500 nm. (B) Cells were treated with 0, 1, and 10 μM Dex for 24 h, then stained with MDC to identify autophagic vacuoles. Scale bar: 50 μm. The number of autophagosomes per cell was quantified by counting the number of autophagosomes in 100 MDC-staining cells. The data were presented as means ± SD of 3 independent experiments. (Dex vs. control: ***P < 0.001) (C) Cells were treated with increasing concentrations of Dex for 24 h, p62 and LC3 were detected by Western blot. (D) Cells were then treated with 1 μM Dex for 0, 24, and 48 h, and p62 and LC3 expression were evaluated by Western blot.