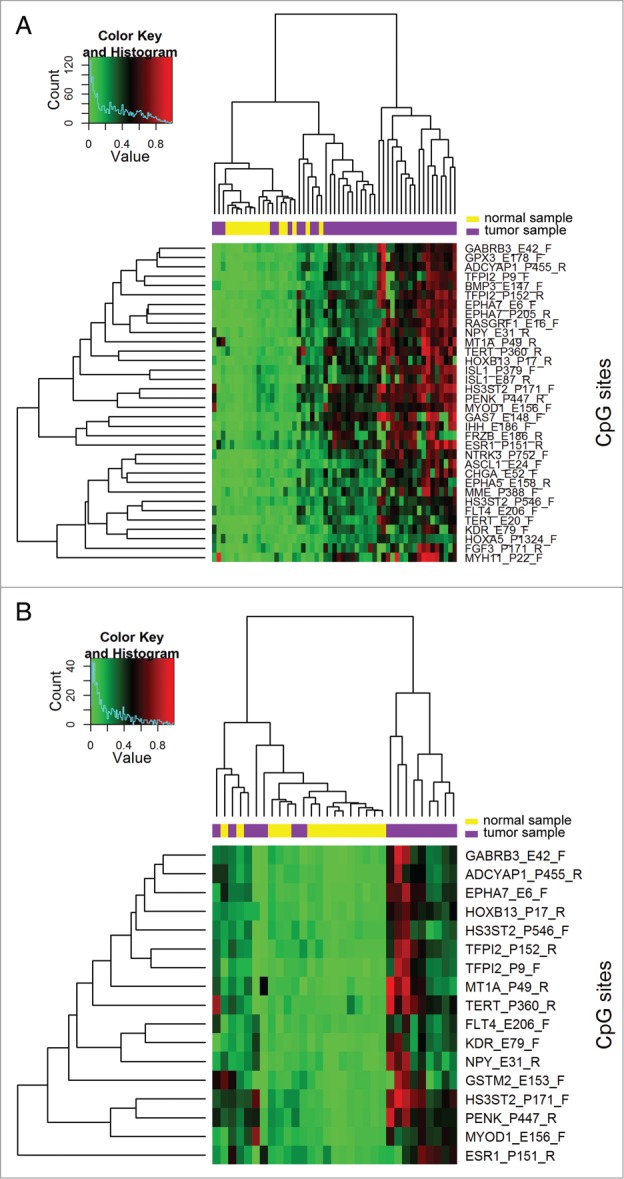
Figure 1.

Hierarchical clustering heat maps and dendrograms for distinguishing (A) OSCC from normal samples and (B) early-stage OSCC from normal samples. Mean β values from the selected CpG sites were used for hierarchical agglomerative clustering based on the Manhattan distance and complete linkage. Low, medium, and high methylation levels are indicated in green, black, and red, respectively.
