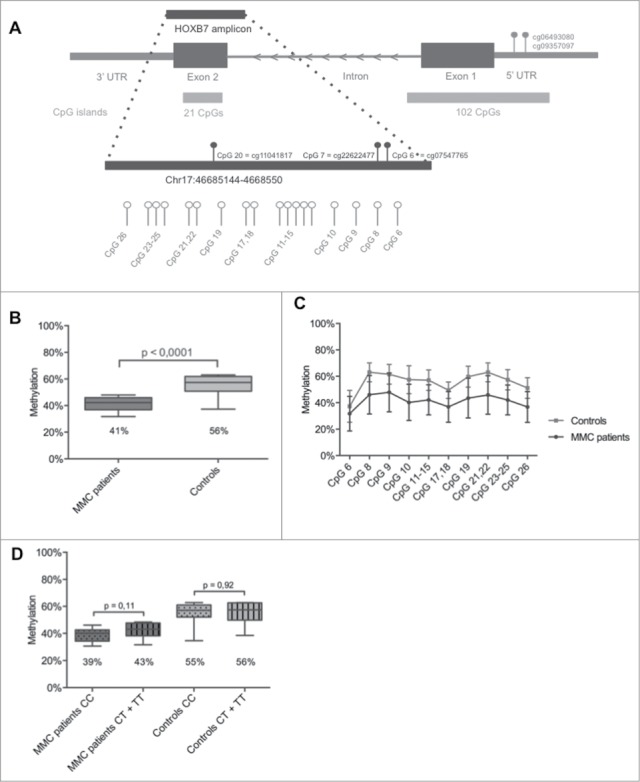
Figure 1.

HOXB7 methylation studies by Sequenom EpiTYPER in MMC patients. (A) Localization of the studied amplicon (Chr17:46,685,144–46,685,550) within HOXB7 Exon 2. The amplicon covers 26 single CpGs and our assay provides data on 10 analytical CpG units. Nucleotide positions accord to the NCBI build 37/hg19. The CpG units studied by 450K Array (cg11041817, cg22622477 and cg07547765) and the in silico analysis (cg06493080, cg09357097) are also indicated. (B): Boxplot representing the methylation pattern of MMC patients and controls with box = 25th and 75th percentiles; bars = min and max values. The mean methylation level of each group is shown below the plot. (C): Methylation pattern for each CpG unit within the amplicon. Wilcoxon Rank-Sum test was performed. (D): Boxplot representing the methylation pattern of MMC patients and controls divided according to MTHFR 677C>T genotype with box = 25th and 75th percentiles; bars = min and max values. The mean methylation level of each group is shown below the plot.
