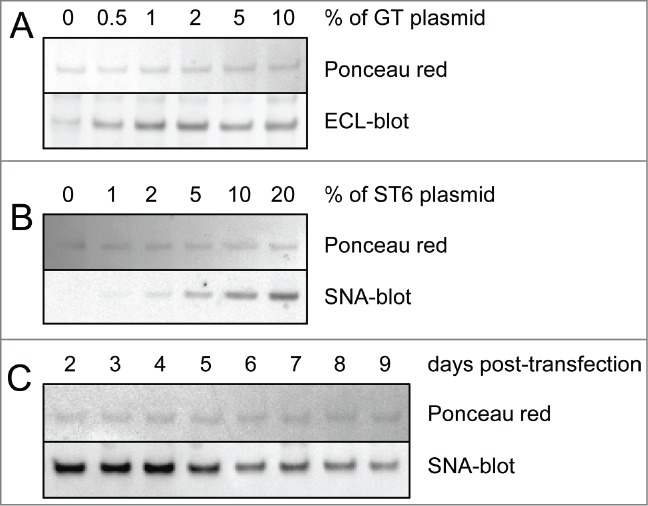
Figure 2.

Lectin-blot analyses of TZM from culture supernatants. Various amounts of glycosyltransferases and harvest time were tested for optimal galactosylation and sialylation of the Fc. The lectin-blots show the mAbs’ heavy chain (reducing gels). Ponceau red staining was used to control the protein load. Panel (A) Co-expression of TZM and GT. The DNA mix was composed of 0% to 10% in weight of GT encoding plasmid, the rest being a 6:4 mixture of plasmids coding for TZM light and heavy chains. ECL was used to detect terminal galactosylation. Panel (B) Co-expression of TZM, GT and ST6. The DNA mix was composed of 2% of GT plasmid with 0% to 20% of ST6 coding plasmid, the rest being a 6:4 mixture of plasmids coding for TZM light and heavy chains. SNA was used to detect terminal α2,6-sialylation. Panel (C) HC α2,6-sialylation level from day 2 to day 9 post-transfection.
