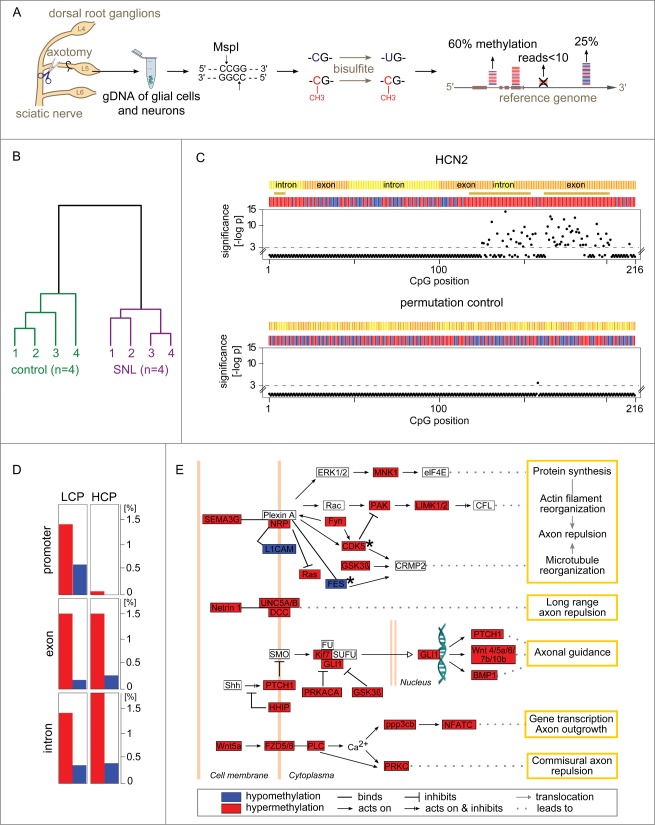
Figure 1 (See previous page).
Gene methylation response to nerve injury. (A) Genome-wide quantification of CpG methylation by RRBS. Genomic DNA from the L5 dorsal root ganglion (DRG) of Brown Norway rats was isolated 24 h after spinal nerve ligation (SNL) or a sham procedure (negative control). Genomic DNA (gDNA) was isolated and subjected to a restriction digest with MspI. DNA fragments were ligated to adapters, bisulfite treated converting unmethylated cytosines to uracils, and sequenced. Resulting paired-end reads—1.1 billion in total from 8 independent libraries analyzed in the present study—were aligned to the rat genome. Cytosine methylation levels were called only for CpG sites covered in a given library by ≥10 independent sequence reads. (B) Nerve injury eliciting methylome alterations: Evidence at the whole-data set level. DNA methylation was markedly altered after SNL. Hierarchical clustering—using all methylation levels measured at 917,097 CpG sites within genes—clearly separated control animals (left) from SNL animals (right). (C) Nucleotide-resolution analysis of the methylation profile of HCN2. Top panel: Changes in methylation were noted in clusters of juxtaposed CpGs. Shown as an example is HCN2, an ion channel modulating inflammatory and neuropathic pain 34. The x-axis indicates the position of captured CpG sites within a gene. RRBS captured 216 CpGs located in gene body of HCN2, while no CpGs were captured in the promoter region for this gene. The negative log-p value of the significance level computed by a likelihood ratio test using a generalized linear model (GLM) is shown on the y-axis. Higher values indicate stronger significance. Differences with a P > 10−3 were considered non-significant (CpG positions shown below the dotted line). Differences at individual CpG sites were highly significant ranging from P < 10−3 to P < 10−14. The bars in the colored band above the scatterplot indicate for each CpG whether the mean methylation level was higher (red) or lower (blue) in the SNL group compared with controls. The direction of change is shown regardless of significance at the level of a specific CpG. Regions that are significantly changed (P < 10−3) according to a sign test of the direction of juxtaposed CpGs are represented by brown stars. Bottom panel: Random permutation of group assignment and CpG positions confirmed that both statistical testing procedures were robust as indicated by low false-positive rates of 0.004 for single CpG testing of HCN2 (1/216 CpG above significance threshold) and of 0 (no false-positive) for regions. Additional examples are shown in Figure S1. (D) Gene types and regions undergoing hyper- and hypo-methylation. The fraction of CpGs with significantly altered methylation was calculated across different gene regions for the entire dataset. Low CpG content promoter (LCP) genes and high CpG content promoter (HCP) genes differed. LCP genes were altered in the promoter, exon, and intron regions. HCP genes harbored a comparable fraction of altered methylation sites only in exons and introns, while HCP gene promoters were unaffected. Hypermethylation (red) accounted for a greater fraction of changes than hypomethylation (blue) in all regions. (E) Axon guidance pathway genes differentially methylated after SNL. The most significantly enriched molecular mechanism in an unbiased global analysis of genes undergoing differential methylation after SNL was the axon guidance pathway (P < 10−11). Depicted are 35 differentially methylated genes with dense connectivity. Variable methylation predominantly occurred in the gene body. Only FES and CDK5 showed methylation alterations in their promoter (black stars). A total of 98 out of 468 axon guidance pathway genes were differentially methylated (complete list provided as Table S1).

