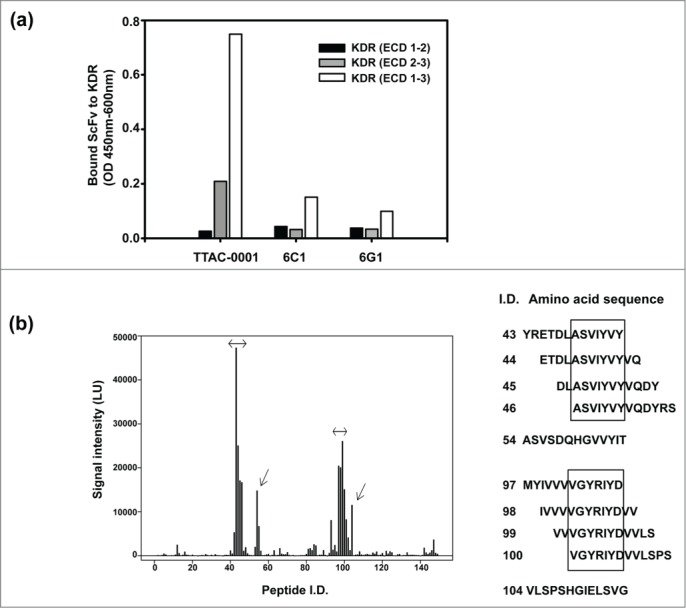
Figure 2.

Domain and epitope mapping of anti-KDR antibodies. (a) Domain mapping analysis of anti-KDR antibodies on the extracellular region of KDR. Black bar represents extracellular domain 1 and 2 of KDR (KDR (ECD 1–2)). Gray bar represents extracellular domain 2 and 3 of KDR (KDR (ECD 2–3)). White bar represents extracellular domain 1, 2 and 3 of KDR (KDR (ECD 1–3)). (b) Peptide microarray for epitope mapping. As an antigen, KDR (ECD1–3) was used. The sequence was scanned with a format of 13meric peptides overlapping 11 amino acid residues with the following peptide, resulting in a total of 149 peptides. The binding of primary antibody (TTAC-0001, control human IgG) to the peptide was measured with dylight-649 labeled secondary antibody. Left panel: Fluorescence intensity of peptide. The intensity of fluorescence measured by TTAC-0001 was subtracted the value of control human IgG (Pierce). Arrows indicate peptides showing over 10,000 LU of signal intensity. Right panel: Amino acid sequence (peptide i.d.) showed high intensity of fluorescence (≥ 10,000 LU). The sequences inside the box indicate epitopes for TTAC-0001.
