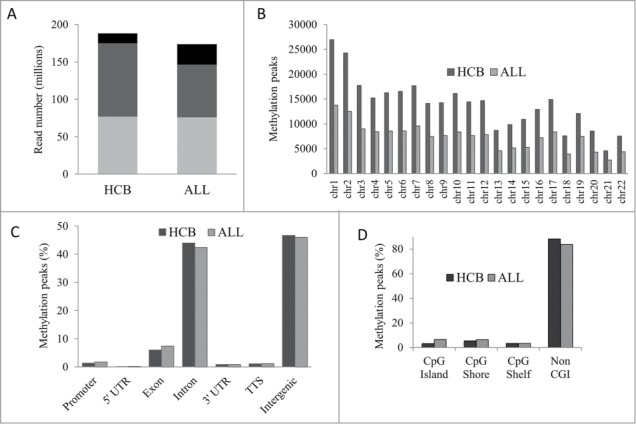
Figure 1.

Genome-wide DNA methylation profiles in HCB and ALL. (A) Average read and alignment statistics. Reads were averaged across all individuals for HCB and ALL samples. The top of each bar represents the total number of reads for each category. Black bars: total reads; Dark gray bars: reads mapped; Light gray bars: unique reads. (B) Chromosome-wise methylation peaks. The X and Y chromosomes were excluded from analysis. (C) Genomic distribution of methylation peaks. TTS: transcription termination site. (D) Methylation peaks in CGI context.
