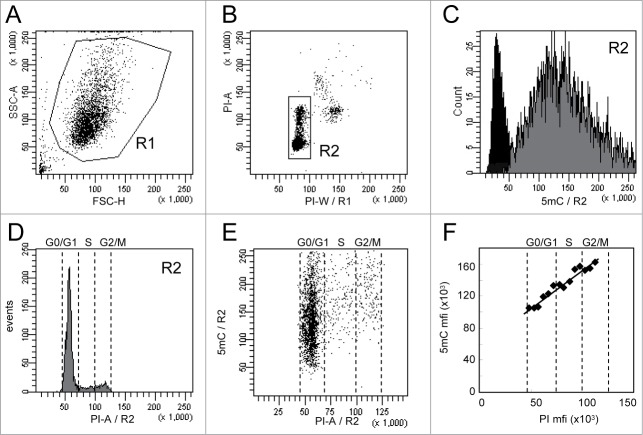
Figure 1.
Analysis of 5-methylcytosine (5mC) content in WM266–4 cells by flow cytometry. Asynchronous WM266–4 melanoma cells were labeled with anti-5mC monoclonal antibody prior to DNA staining with propidium iodide (PI). For flow cytometry analysis, cells were selected according to their FSC and SSC parameters (R1 region) (A) and then gated on their PI content (R2 region) (B). 5mC labeling of the R2 cells (gray histogram) and its isotypic control (black histogram) are displayed on a fluorescence histogram with a linear scale (C). Analysis of cell cycle (D) is combined with analysis of DNA methylation, as shown on the dot plot in (E). The graph (F) reports the mean of fluorescence intensities of 5mC (anti-5mC antibody mfi minus isotype control mfi) and PI measured in contiguous intervals (5000 mfi units) on the PI scale.

