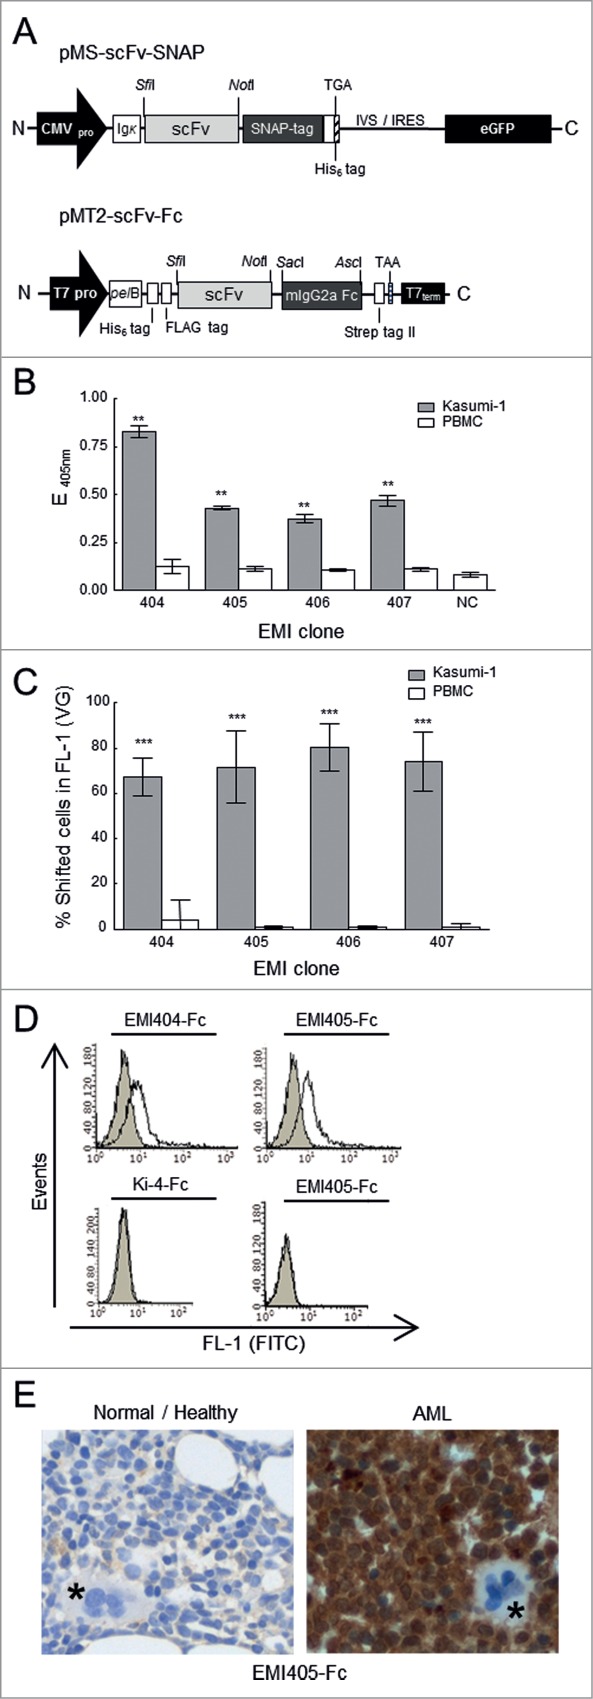
Figure 3.

Construction and binding analysis of purified scFv-SNAP-tag and scFv-Fc fusion proteins. (A) Upper diagram: Schematic diagram of the bicistronic eukaryotic expression cassette for recombinant SNAP-tag fusion proteins. Under the control of the cytomegalovirus promoter (CMV pro), the pMS scFv-SNAP vector encodes the antigen binding domain (scFv) joined in-frame to the SNAP-tag. The immunoglobulin kappa leader sequence (Ig κ) upstream of the scFv-SNAP‑tag fusion leads to the secretion of fusion proteins into the supernatant, and a TGA stop codon is placed immediately after the C-terminal His6 tag. The transcribed internal ribosome entry site (IVS-IRES) mediates the cotranslational expression of enhanced fluorescent protein (eGFP). Lower diagram: Schematic diagram of the pET-derived expression cassette. Under the transcriptional control of the T7 promotor (T7pro) and T7 terminator sequence (T7term), the pMT2-scFv-Fc vector encodes a scFv antibody fragment joined in-frame to constant mouse immunoglobulin gamma 2a domain (mIgG2a). IgG2a constant domain enables the use of standard immunohistochemical visualization techniques. The fusion protein is expressed with an N-terminal hexa-histidine tag (His6) followed by a FLAG tag including an enterokinase cleavage site and translocated into the periplasmic space of E. coli by the Erwinia carotovora pectate lyase B (pelB) signal peptide. The stop codon TAA is generated immediately after the C-terminal Strep tag II. His6 tag, FLAG tag and Strep tag II facilitates purification and detection of recombinant proteins. (B) Binding analysis of scFv-SNAP‑tag fusion proteins in a monoclonal scFv ELISA against functional membrane fragments. Tumor binding activity to AML-derived Kasumi‑1 cells (gray bars) was compared to healthy peripheral blood mononuclear cells (PBMCs, white bars). (C) Flow cytometry of fluorophore-labeled scFv-SNAP‑tag proteins on Kasumi‑1 (gray bars) and PBMCs (white bars) cells. After subtraction of background fluorescence, the percentage of fusion protein binding was detected in the FL‑1 channel (488 nm). NC: negative controls. VG: Vista Green. The stars indicate a significant difference relative to the PBMC controls. (D) Flow cytometry analysis showing the binding activity of EMI404-Fc and EMI405-Fc to fresh patient-derived AML cells. Filled gray curves represent untreated cells. Cells were incubated with the fusion protein (black curve). To exclude nonspecific staining of the FITC labeled goat anti-mouse (GAM-FITC) detection antibody, omission of the Fc-tagged fusion proteins served as control (light gray curve). To exclude nonspecific binding of the Fc domain AML blast cells were stained with the irrelevant scFv-Fc fusion protein Ki-4-Fc (left bottom). To exclude unspecific binding, stainings were also performed on healthy donor PBMC (right bottom). (E) Immunohistochemical analysis of bone marrow sections with EMI405-Fc fusion protein, magnification x 400. Right panel (AML bone marrow biopsy sections) shows exemplary the immunological detection of AML blast cells. Left panel (normal/healthy biopsy sections) shows no evidence of blast cell infiltration. Megakaryocytes are marked in asterisks.
