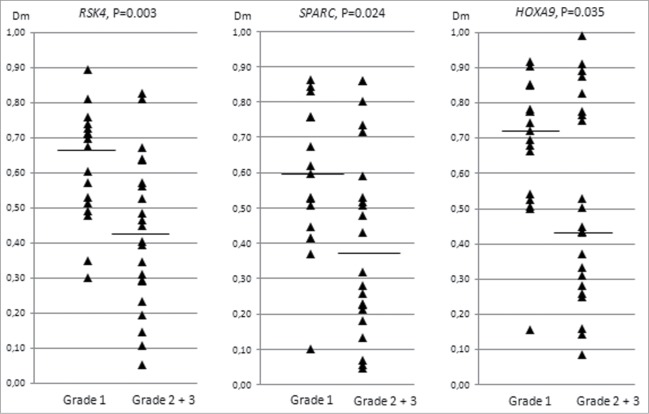
Figure 3.
Distribution of methylation dosage ratios (Dm values) for RSK4, SPARC, and HOXA9 in endometrioid ovarian carcinomas (sporadic and Lynch-associated combined) stratified by grade (low refers to grade 1 and high to grades 2 and 3). The horizontal line denotes the median and each triangle represents the Dm value of individual data point. Significance values by t-test for independent samples are shown.

