
Figure 3.
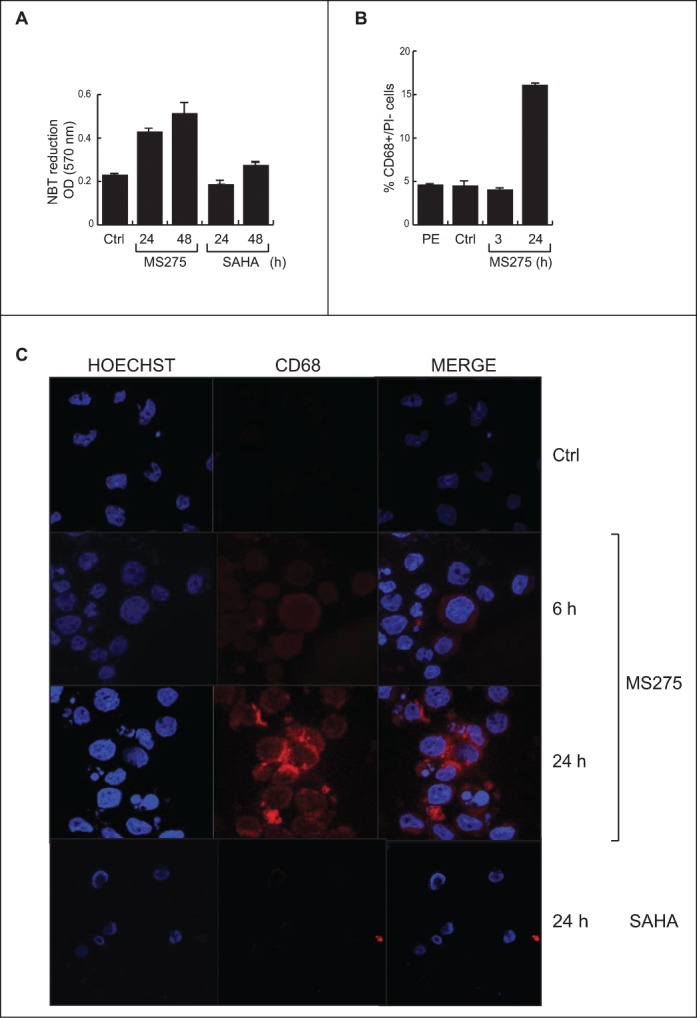
MS275, but not SAHA, induces expression of CD68 in leukemia. (A) NBT assay in U937 cells upon MS275 and SAHA treatment at 24 and 48 h. Error bars represent standard deviation from 2 independent experiments carried out in duplicate. (B) FACS analysis of CD68 expression in U937 cells upon MS275 treatment at 3 and 20 h. Error bars represent the standard deviation of 2 independent experiments carried out in duplicate. (C) IF analysis of CD68 showing CD68 localization in U937 cells treated with MS275 (5 μM) and SAHA (5 μM) for the indicated times. Cells were fixed and immune-stained with anti-CD68 (red). Nuclear DNA was stained with Hoechst (blue) and visualized using confocal microscopy. Scale bar 10 μm.