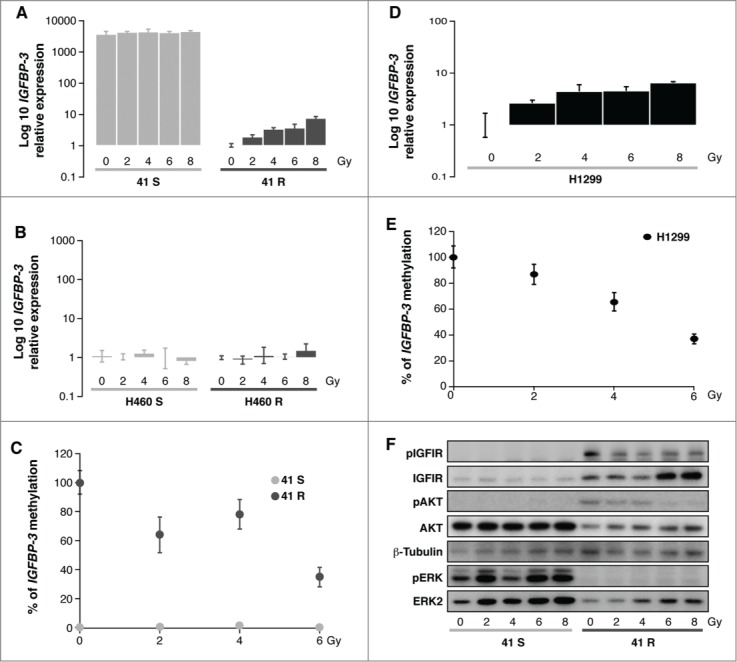
Figure 2.

(A, B, D) Quantification of IGFBP-3 expression levels in 41S/R, H460S/R and H1299 cells 72 h after IR treatment using the resistant untreated controls (0Gy) as calibrators. (C, E) Methylation levels of IGFBP-3 in 41S, 41R and H1299 cells 72 h after irradiation.. The calculation of the IGFBP-3 gene to β-actin ratios was based on the fluorescence emission intensity values for both genes at 0, 2, 4 and 6 Gy. The data were normalized to each untreated control, set to 100%, and represent the mean ± standard deviation of at least 3 independent experiments performed in triplicate at each concentration for every cell line analyzed. (F) Activation of the ERK and IGFIR/AKT axes 72 h after radiation in the 41S and 41R cell lines at 5 IR doses.
