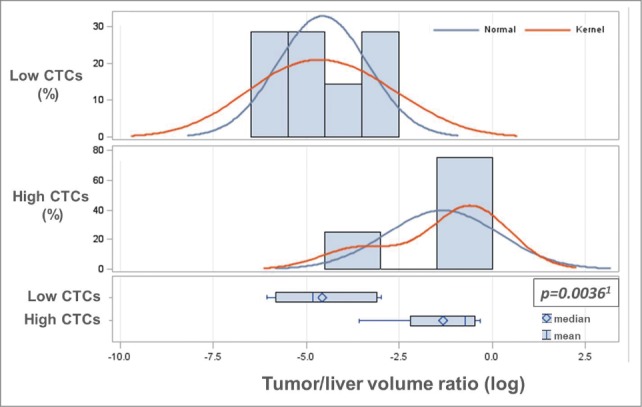
Figure 1.

Baseline CTC levels correlate with tumor burden in the liver. To statistically analyze the association between CTC numbers and tumor burden in the liver, baseline CTCs were categorized into low (0–2) and high (≥3), and the tumor/liver volume ratio was log-transformed to assure the validity of statistical assumptions. A significant association between the log-transformed tumor/liver volume ratio and baseline low/high CTC levels by both parametric (1two-sample T-test (P = 0.0036)) and non-parametric (Wilcoxon Rank-Sum test) (P = 0.0298) analysis was determined. As shown in Table 3, the tumor/liver volume ratio was dichotomized into low (<30%) and high (≥30%) tumor/liver volume ratio, which was also found to be significantly associated with baseline CTC levels (high/low).
