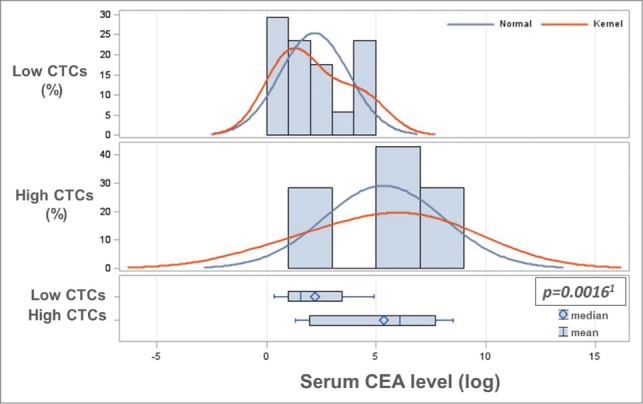
Figure 2.

Baseline CTC levels correlate with serum CEA levels. Baseline serum CEA levels were log-transformed to stabilize the variance and make the associated statistical assumption more valid. A significant association between log-transformed serum CEA levels and categorized baseline CTC counts (low: 0–2, high: ≥3) was determined by parametric (1two-sample T-test (P = 0.0016)) and non-parametric analysis (Wilcoxon Rank-Sum test (P = 0.0092)). As shown in Table 3, baseline serum CEA levels were also categorized and the correlation analysis with low/high baseline CTC levels was also statistically significant.
