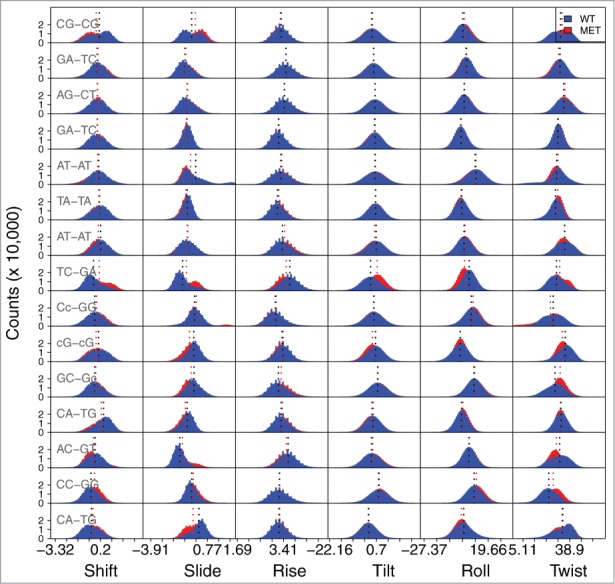
Figure 6.

Frequency of values for the local base parameters for the d(5’- CCGAGATATCCGCACCAACG-3’)2 and the corresponding methylated sequence. The base step values for the 2 last bps at the 5′and 3′ termini are not shown. Due to space constraints on the figure, the 5-mC modification is represented by just the lowercase letter c. The shift, slide and rise parameters are expressed in Ångström, and the tilt, roll and twist parameters in degrees. The average values are depicted by the dotted lines. The values for the average and standard deviations of each parameter are presented in Table S12.
