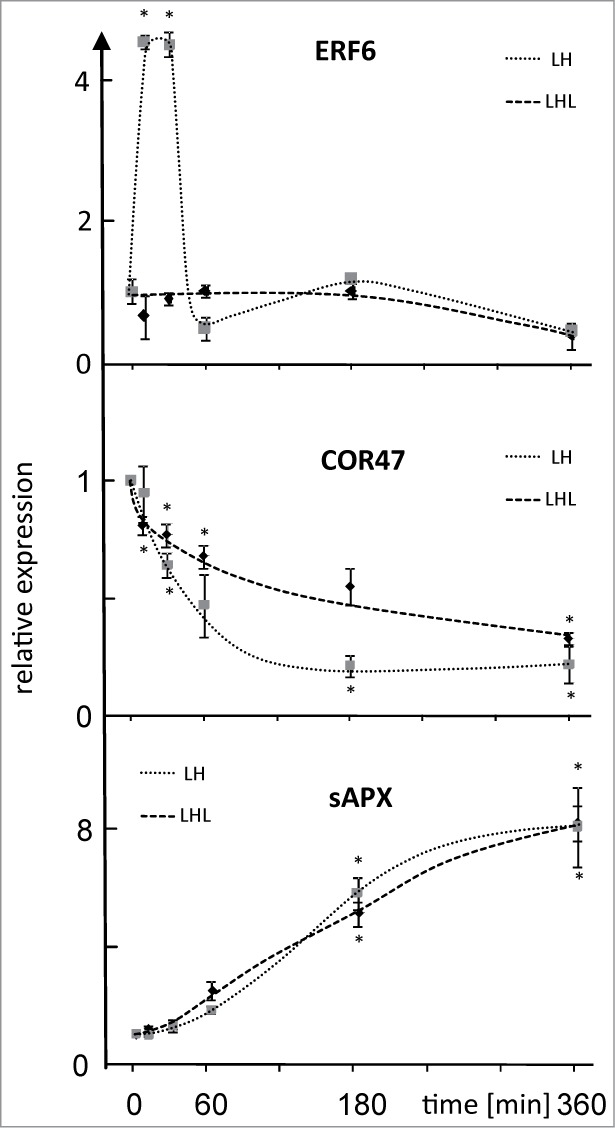
Figure 2.

Expression level of ERF6, COR47 and sAPX after LH→L- or L→H-treatment. Transcript levels were quantified by qPCR in response to L→H shift at indicated time points. Parallel samples were transferred back to L-light after H-light-treatment and harvested at t = 360 min. Data are means ± SE of n = 3 independent experiments (with replicates), asterisks indicate significant difference to t = 0 min (Student's t-test P < 0.05).
