Figure 6.

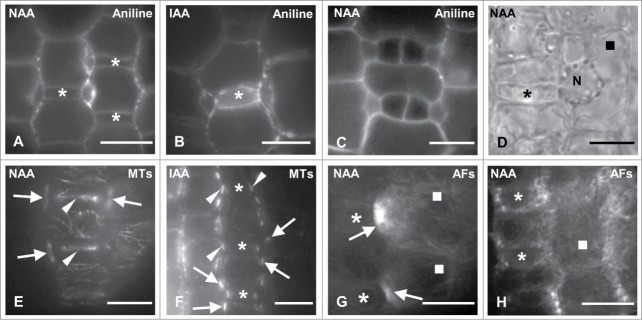
(A–C) Protodermal areas near the leaf base of NAA- (A and C) and IAA-treated (B) seedlings as viewed after aniline blue staining. Bilaterally to the young GMCs (asterisks in (A) and (B)) subsidiary cells have been formed (cf. Fig. 2A and B). The stomatal complexes shown in (C) have been formed before the GMCs acquire a square shape (compare Fig. 2C and D). (D) DIC optical view of polarized NAA-treated SMC (square) in contact with a young GMC (asterisk) (cf. Fig. 2B and C). N: nucleus. (E and F) NAA- (E) and IAA- (F) treated young GMCs (asterisks) and their neighbor SMCs after tubulin immunolabeling in external (E) and median (F) optical plane. The arrows point to profiles of preprophase MT-band in SMCs and the arrowheads to the interphase MT-ring in GMCs. (G) AF-organization in NAA-treated SMCs (squares) in contact with advanced GMCs (asterisks).The arrows show AF-patches. (H) AF-organization in young NAA-treated GMCs (asterisks) and their adjacent SMCs (square). Treatments: NAA 100 μM, 48 h; IAA 200 μM, 48 h. Scale bars: 10 μm.
