
Figure 1.
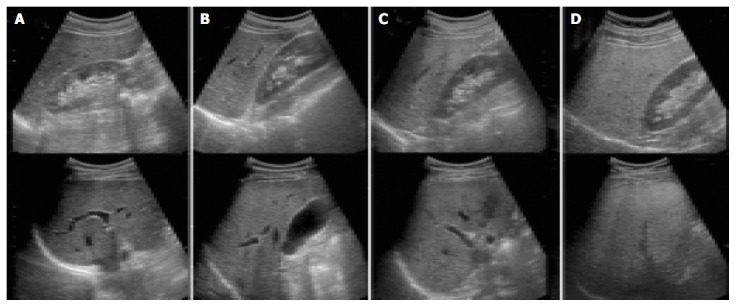
Ultrasonographic findings of liver according to the degree of steatosis. (A) Normal liver, (B) mild steatosis: a slight augmentation in liver echogenicity, a slight exaggeration of echogenic discrepancy between liver and kidney, and a relative preservation of echo line in the portal vein wall. (C) Moderate steatosis: a loss of echo line in the portal vein wall, particularly from the peripheral branches, resulting in a featureless appearance of the liver. (D) Severe steatosis: much greater reduction in echo penetration, a loss of echogenicity in most of the portal vein wall, including the main branches, and a large echo discrepancy between liver and kidney. Adapted from Saverymuttu et al[17].