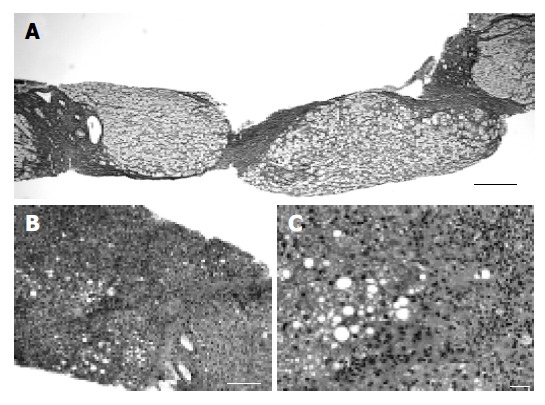
Figure 2.

Microscopic features of the liver biopsy specimen. A: Micronodular cirrhosis has become established (silver impregnation, scale bar = 200 µm); B: Low power view of the liver biopsy specimen (hematoxylin and eosin stain, scale bar = 200 µm). Fatty degeneration and marked fibrosis with inflammatory cell infiltration were observed; C: High power view of the liver biopsy specimen (hematoxylin and eosin stain, scale bar = 20 µm). Foci of hepatocellular necrosis and dense fibrosis with neutrophilic infiltration were observed. Hepatocytes showed both the microvesicular and macrovesicular types of steatosis.
