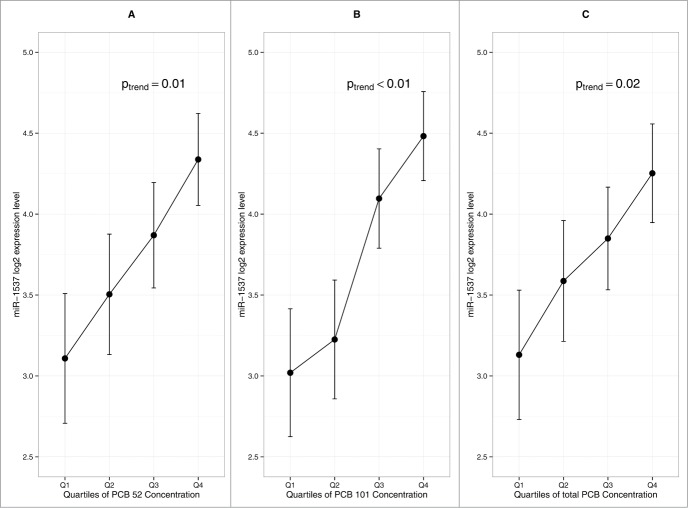
Figure 3.
Influence of PCB congeners on placental miRNA profile (n = 105). (A) Association between miR-1537 and PCB 52 (B) Association between miR-1537 and PCB 101 (C) Association between miR-1537 and total PCB. Error bars represent standard error interval. P-value is based on generalized linear model.

