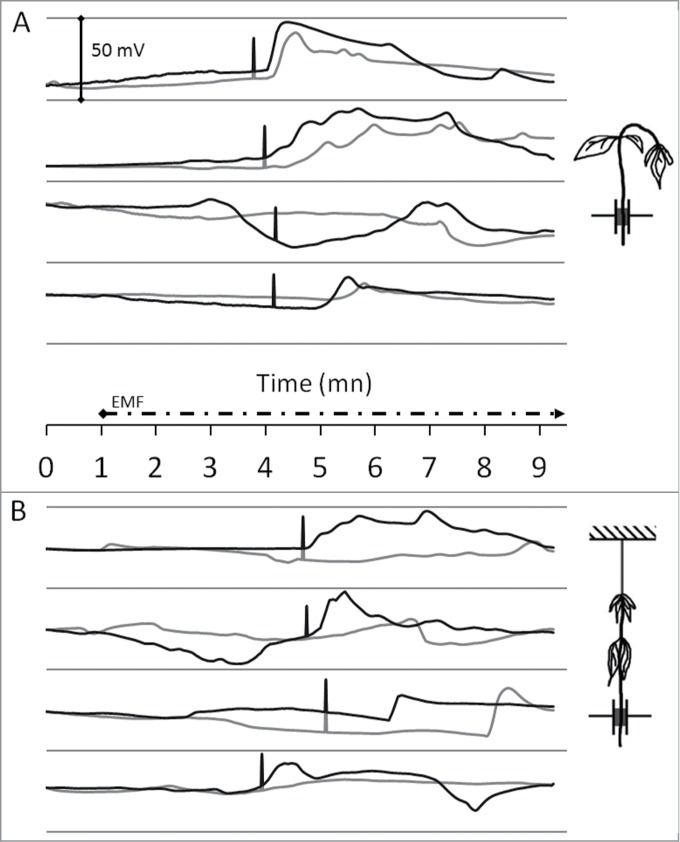
Figure 3.

Sunflower exposition to high-intensity microwave-frequency EMF. Height sunflower plants were exposed to a 2.5 GHz ‑ 1.5 kV/m EMF (dashed timeline). The graphs show the monitoring of EPV with 2 tungsten electrodes (up: black-line; down: gray-line) inserted as described in Figure 1B. Data are baseline-adjusted and expressed in millivolt (the plants resting electrical potentials were 200 to 350 mV). Black bars symbolize the time point of stem or petiole bending. Free apex (A): Four sunflower plants were exposed to EMF as described in Figure 1. Tied apex (B): To avoid stem bending, the sunflower plants apexes were tied with a non conductive plastic string, before exposure to EMF.
