Figure 1.
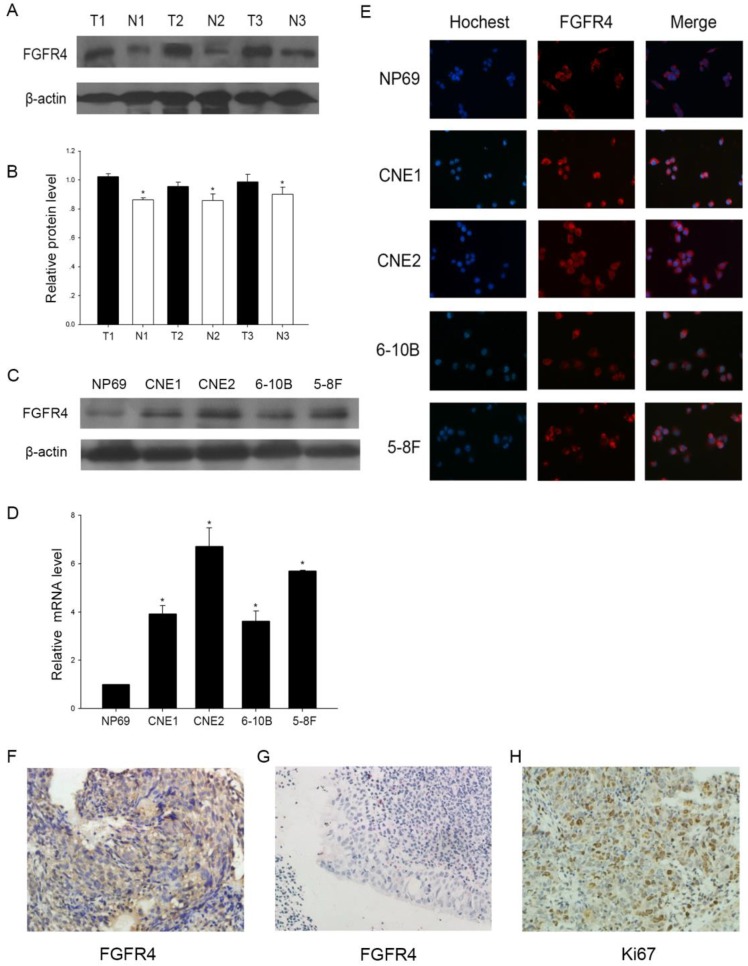
The expression of FGFR4 in NPC. A: Western blot of FGFR4 in 3 NPC tissues and 3 inflammatory nasopharyngeal tissues. (T) Nasopharyngeal squamous cell carcinoma tissues. (N) Inflammatory nasopharyngeal epithelium tissues.β-actin was used as a control for protein load and integrity. B: The bar demonstrated the ratio of FGFR4 protein expression to β-actin by densitometry. C: Expression level of FGFR4 in NPC cell lines or normal nasopharyngeal epithelial cells by Western blot analysis. D: qRT-PCR was used to detect the relative expression of FGFR4 in cell lines. E: Immunofluorescence analysis of FGFR4 expression in NPC cell lines and the normal cell line. DAPI was used for counterstaining of the nucleus in blue. FGFR4 staining was in red. F: High expressions of FGFR4 were observed in NPC tissues (×400). G: Low expressions of FGFR4 were observed in inflammatory nasopharyngeal epithelium tissues (×400). H: High expressions of Ki67 were found in NPC tissues (×400). The data shown were representative of at least three independent experiments. * P < 0.05.

