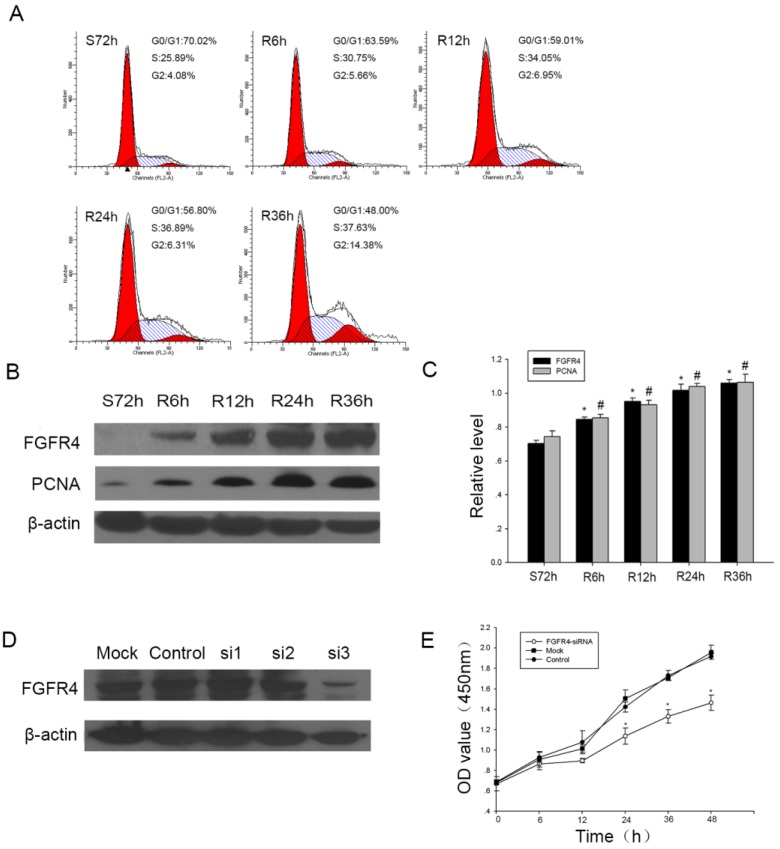
Figure 3.
The expression of FGFR4 in proliferating CNE2 cells. A: Flow cytometry was used to quantify the cell cycle progress.Cells were subjected to serum starvation for 72h (S72h), then addition of medium containing 10% FBS for the indicated times (R6h, R12h, R24h, R36h). B: CNE2 cells were subjected to serum starvation and releasing and Western blot was used to investigate the expression of FGFR4 and PCNA in CNE2 cells during the progression.β-actin was used as a control for protein load and integrity. C: The bar demonstrated the ratio of FGFR4 and PCNA protein expression to β-actin by densitometry. The data shown were representative of at least three independent experiments. Data were analyzed by Student's t-test. *,# P < 0.05. D: Western blot showed the expression of FGFR4 after CNE2 cells transiently transfected with siRNA targeting FGFR4 (si-1, si-2, si-3) or a scrambled sequence (control siRNA). E: Proliferation was determined by CCK8 assay after CNE2 cells treated with FGFR4-siRNA or control siRNA for the indicated time. The data were means± SEM. * P <0.05.

