Figure 2.
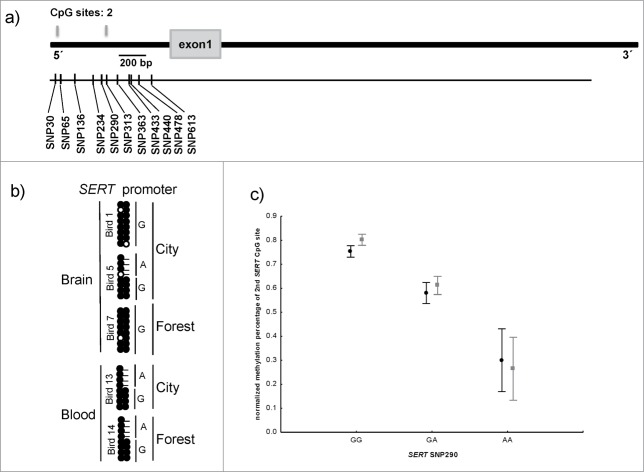
Structure and methylation profile of the SERT promoter. (a) The Schematic representation of SERT gene. Gray boxes showing the location of CpG sites and the gray box represents the exon. The location of SNPs is shown by black bars. (b) The methylation status at 2 CpG sites in the SERT promoter in brain and blood-derived samples. (c) Variation in methylation percentage of second CpG site in the SERT promoter, according to habitat and SNP290 genotype. The black data points represent forest birds and the gray urban birds. Methylation percentage was both affected by genotype and habitat, but the lack of significant interaction suggests that the difference between habitats was similar for the different genotypes (see text for tests).

