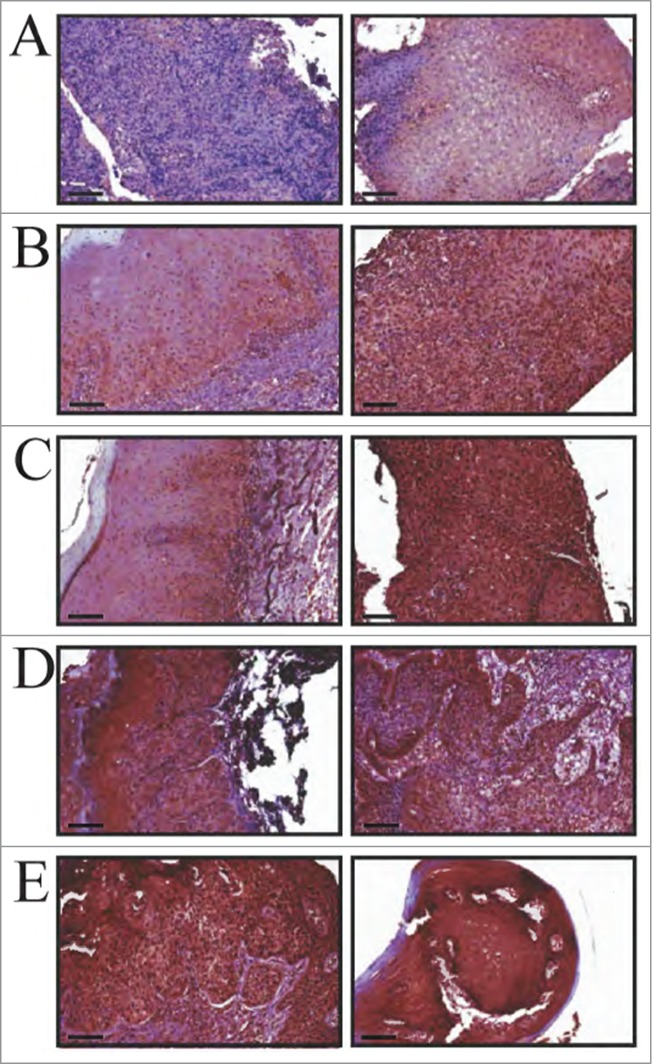
Figure 6.

MIEN1 expression in clinical specimens obtained over multiple visits (longitudinal specimens from 4 patients). (A, left) Control IgG negative staining; (A, right) Benign hyperplastic tissue adjacent to the tumor. (B) Patient 1 showing (left) mild dysplasia and (right) squamous cell carcinoma. (C) Patient 2 displaying (left) mild dysplasia and (right) squamous cell carcinoma. (D) Patient 3 and (E) Patient 4 demonstrating (left) severe dysplasia and (right) squamous cell carcinoma. (B-E) Left and right images are representations from 2 different visits. Scale: 20× (100 μm) magnifications.
