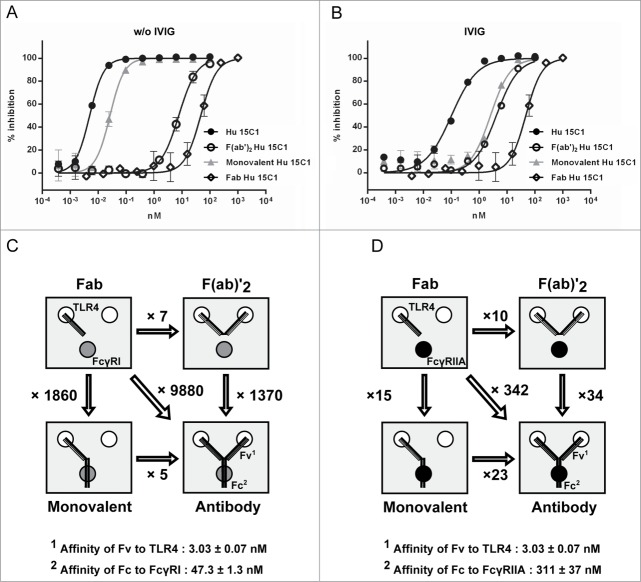
Figure 3.
Hu 15C1 co-engages 3 receptors at the cell surface to provide maximal inhibition of TLR4 responses (A) Dose response inhibition of LPS-induced TLR4 activation in THP1-Xblue cells by Hu 15C1 (black circles), monovalent Hu 15C1 (gray triangles), F(ab)’2 Hu 15C1 (open circles) and Fab Hu 15C1 (open diamonds) when FcγRs are available or (B) after adding IVIg. Results are expressed as mean ± SD of duplicates. An F test was used to compare the fitted curves of different groups. The p values are presented in Tables S2 and S3, respectively. (C) and (D) Schematic representation of the different antibody formats used in (A) and (B), respectively, and their relative capacity at binding TLR4 and FcγRs. The number indicated with each arrow linking 2 antibody formats corresponds to the ratio of the IC50 of the first molecule divided by the IC50 of the second molecule.

