Figure 4.
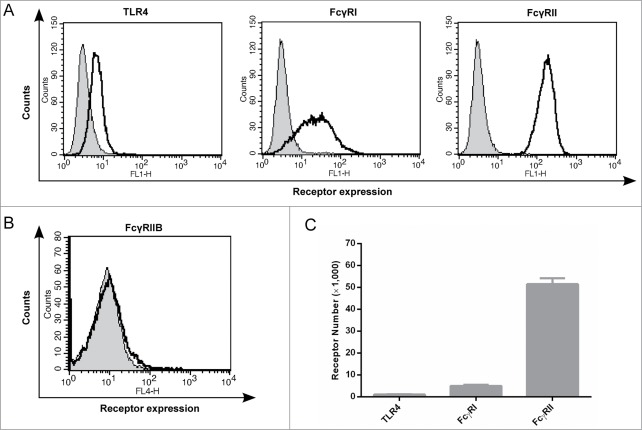
Levels of TLR4 and FcγRs expressed at the cell surface of THP1 cells (A) The expression levels of TLR4, FcγRI, and FcγRII at the surface of THP1-Xblue cells as measured by flow cytometry; isotype control (grey); for TLR4, FcγRI and FcγRII; Hu 15C1, 10.1 and IV.3 antibodies were used, respectively (black). (B) The expression level of FcγRIIb at the surface of THP1-Xblue cells as measured by flow cytometry; isotype control (grey); Hu 15C1 (black). (C) Receptor number on THP1-Xblue cells as determined using calibration beads and flow cytometry. The receptors densities were measured in duplicate with cells at passage 5 and 15. The variations between measurements are indicated by the error bars.

