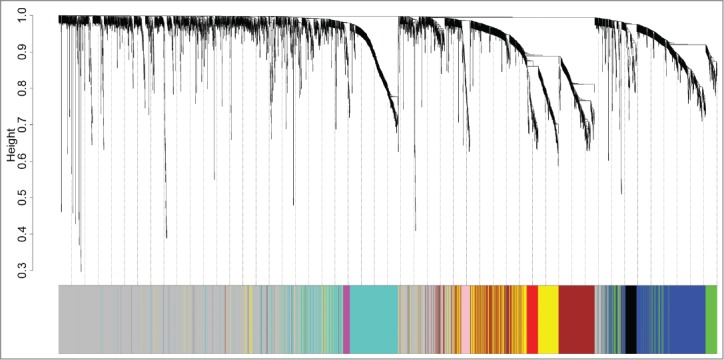
Figure 1.

Identification of ER+ breast cancer specific modules using WGCNA. The clustering dendrogram of gene profilers from the data set GSE6532 with 87 ER+ breast cancer patients. Hierarchical cluster analysis dendrogram was used to detect coexpression clusters. Each short vertical line corresponds to a gene and the branches are expression modules of highly interconnected groups of genes with a color to indicate its module assignment. In total, 9 modules ranging from 37 to 507 genes in size were identified. The gray color suggests the 1546 genes that are outside of all the modules.
