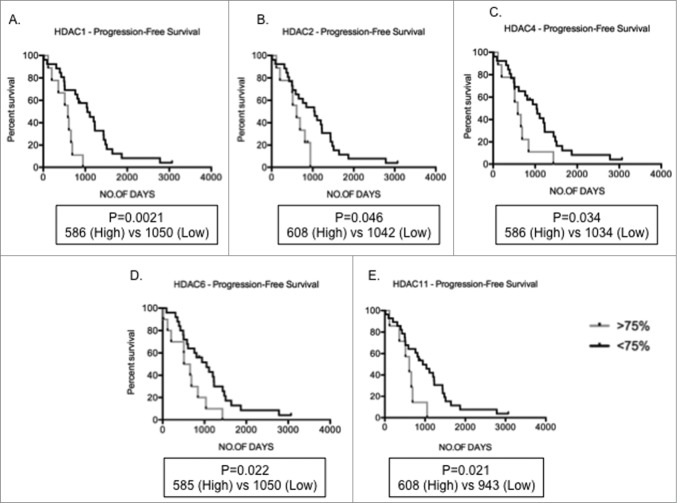
Figure 3.
Increased HDAC levels correlate to poor prognosis Kaplan-Meir plots showing progression-free survival (PFS) in MM patients with high (>75th centile of MM patient cohort) compared to low (<75th centile) expression profiles. (A-E) Patients with high HDAC1, HDAC2, HDAC4, HDAC6, and HDAC11 expression depicted significantly shorter PFS days than patients with low levels of these genes. Significant differences and median survival days were calculated utilizing GraphPad Prism 5.0d. P-values are indicated.

