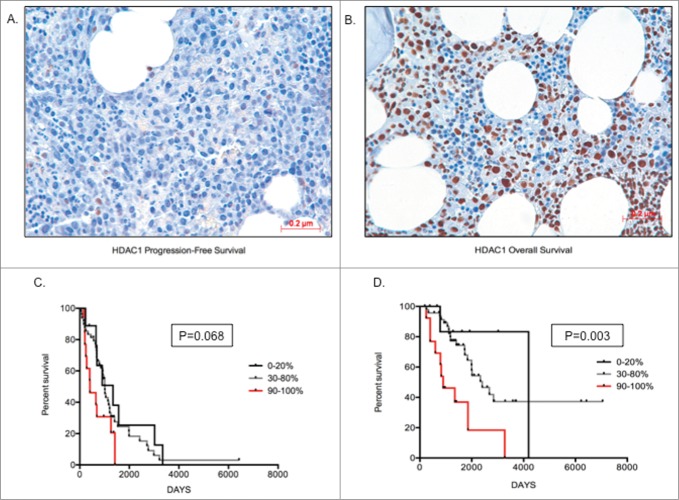
Figure 4.
Higher HDAC1 levels correlate with poor prognosis (A) Image depicting low staining of HDAC1 (20%) in MM cells; (B) Image depicting high proportion of HDAC1 staining (90%) in MM cells; (C) Kaplan-Meir survival plots for patients with 0–20%, 30–80%, and 90–100% proportion of HDAC1 staining, indicating patients with higher proportion of HDAC1 have shorter progression-free survival days; (D) Kaplan-Meir survival plots for patients with 0–20%, 30–80% and 90–100% proportion of HDAC1 staining indicating patients with higher proportion of HDAC1 have shorter overall survival days. Patients with >70% infiltration of MM cells was chosen for image capture. Significant differences and median survival days were calculated utilizing GraphPad Prism 5.0d and p-values are indicated.

